Artificial Intelligence
for geology and mining

An AI assistant that knows every tool and every layer of your data. It assists you through the whole workflow: spectral analysis, prospectivity, geological mapping, terrain modeling, InSAR. Step by step, in plain language.

Terracroma at a glance

An AI-orchestrated geospatial platform for geology, mining, and site monitoring.

One intelligent workspace · four operational layers. AI, remote sensing, geology, terrain, InSAR, documents, camera analytics and occupational safety — accessed through a single conversational layer.

Section 0 · The problem

From fragmented geo-data
to actionable decisions.

Teams in mining, geology, infrastructure and environment do not lack data — they lack a way to combine it. Today, every decision still requires manually stitching together a long list of technical sources.

THE INPUTS

The technical layers a single decision typically touches — each in a different format, tool, and silo:

Satellite imagery Spectral indices Geological maps Deposit databases Terrain models InSAR displacement Field instrumentation Camera feeds Reports & drilling logs GIS outputs

The real question

It isn't "we need another map". It is: How do we turn many technical data sources into fast, explainable decisions?

That's the gap TerraCroma closes — one workspace, one conversational layer, every source connected.

01

Block 01 · Orchestration layer

AI Assistant

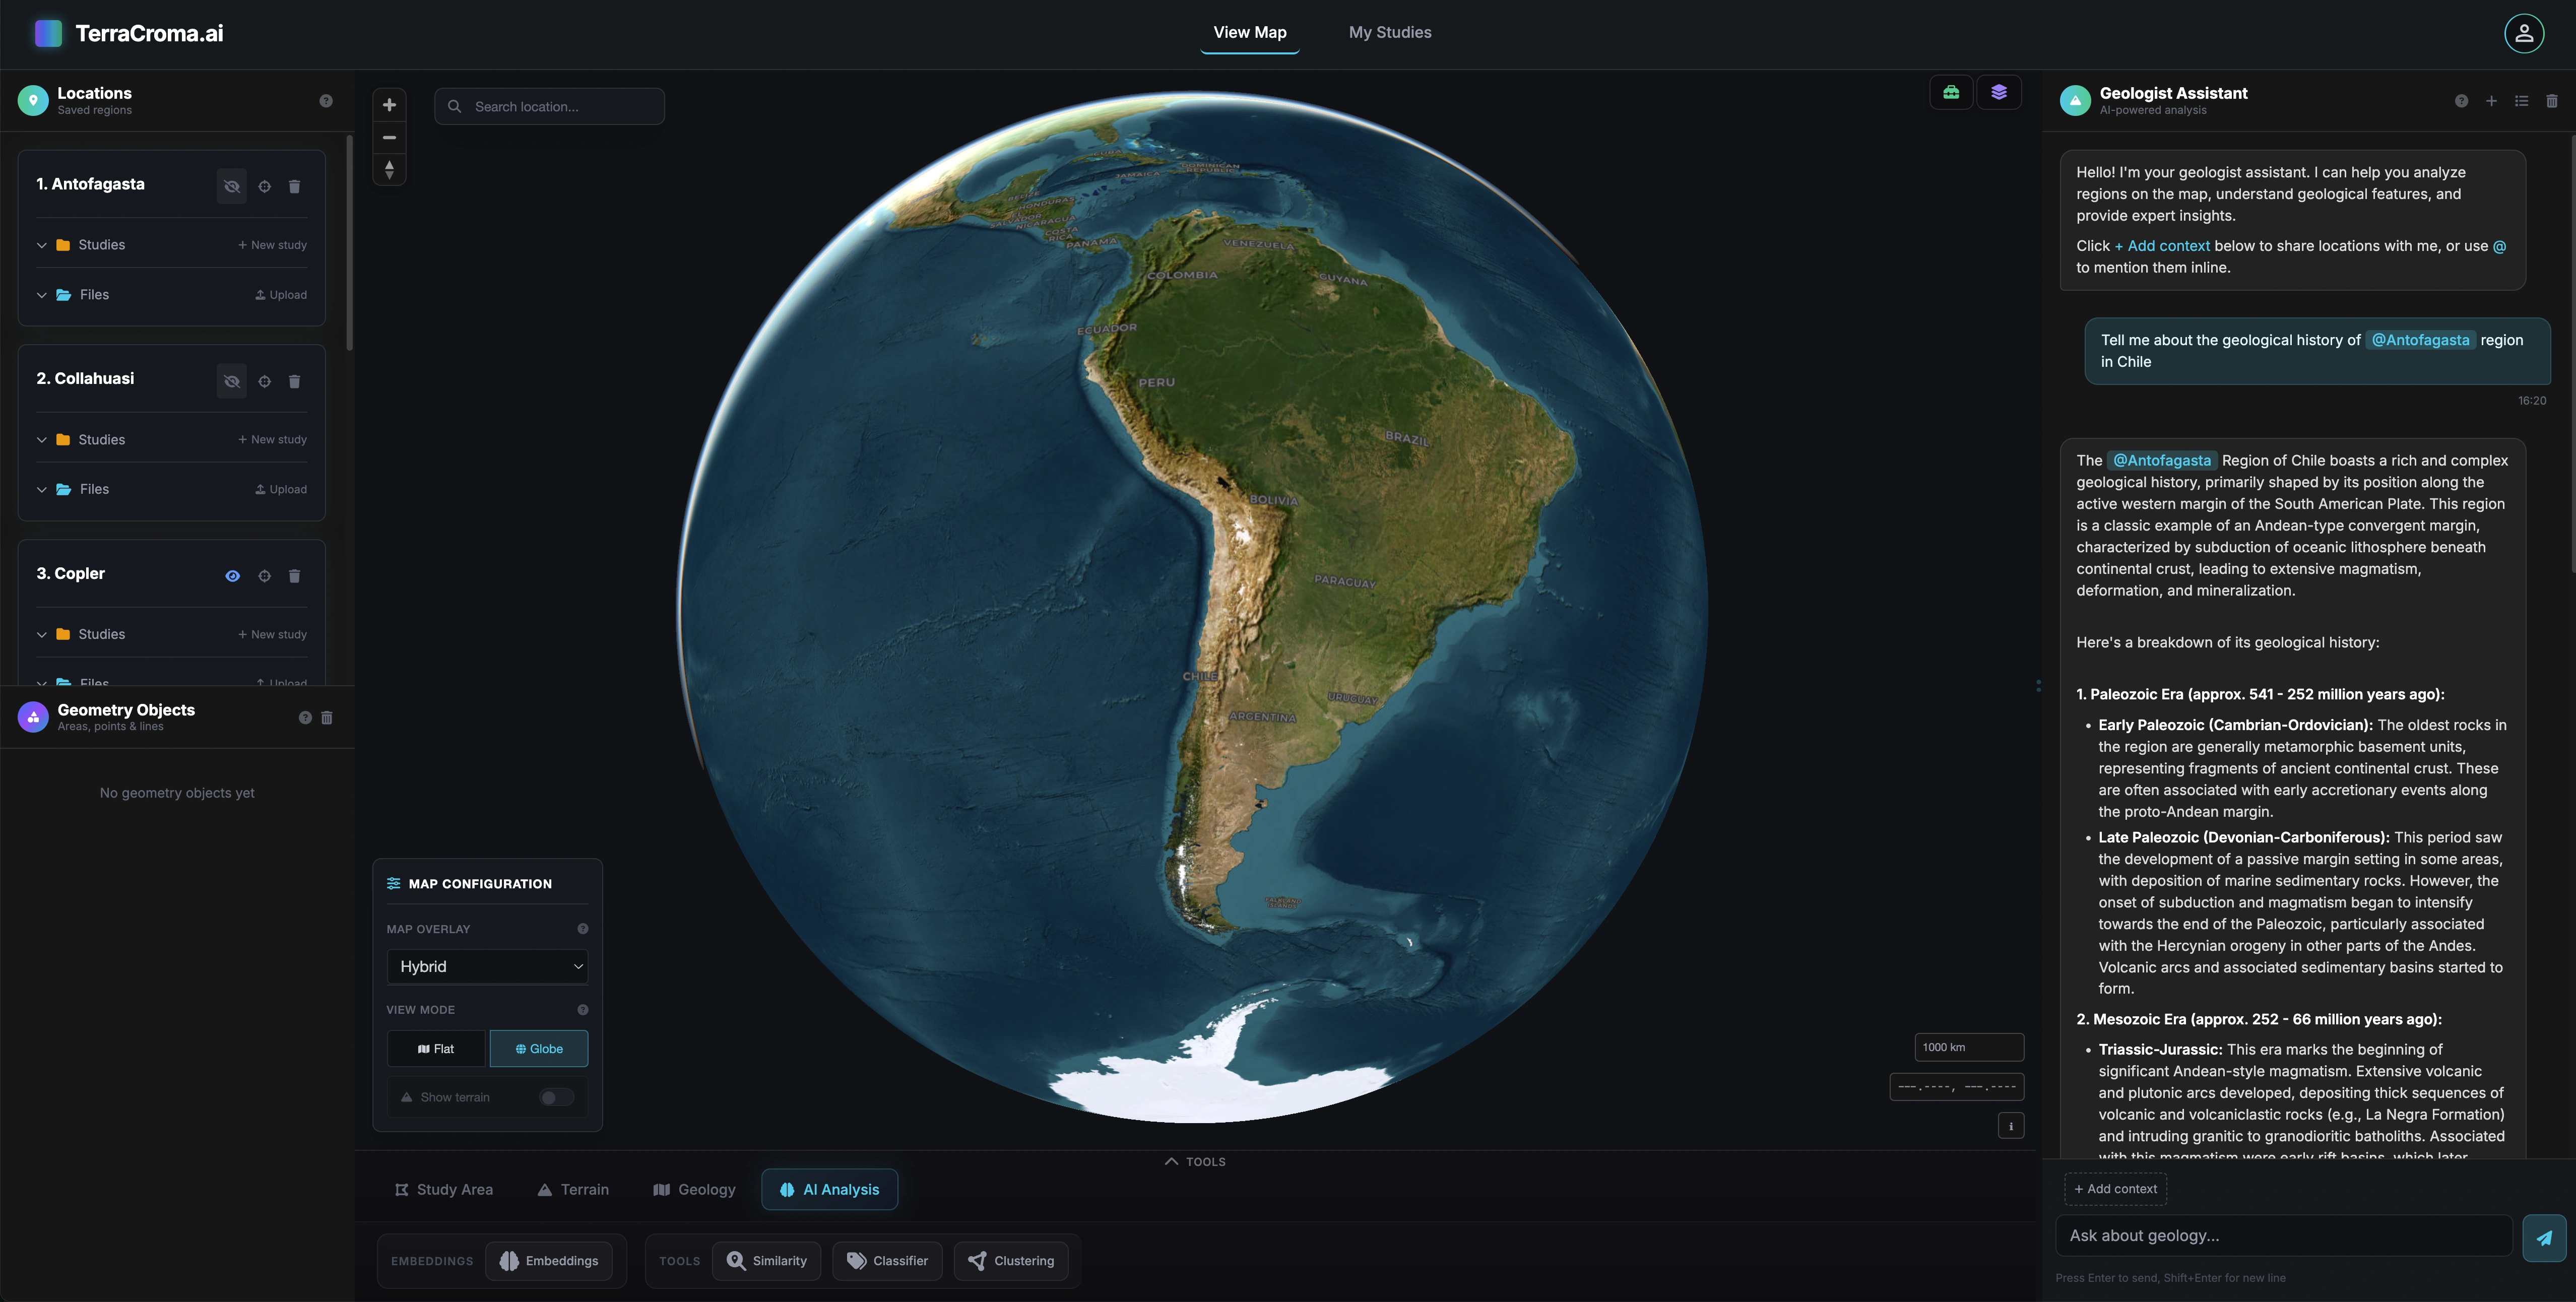
The conversational control surface. Operates every other block on your behalf — chains tools, runs workflows, explains results in plain language, with an optional self-hosted deployment over your private corpus.

AI Assistant

A conversational AI assistant for the entire geo workflow.

Knows every tool. Knows your data. Helps at every step. Describe what you want. "map iron oxide alteration around this district, find every fault within 5 km, rank the overlap", and the assistant picks the right tools, sequences them, and merges their outputs into a single answer.
Assistant demo

Conversational analysis

Describe what you want to see. The assistant runs the workflow for you.
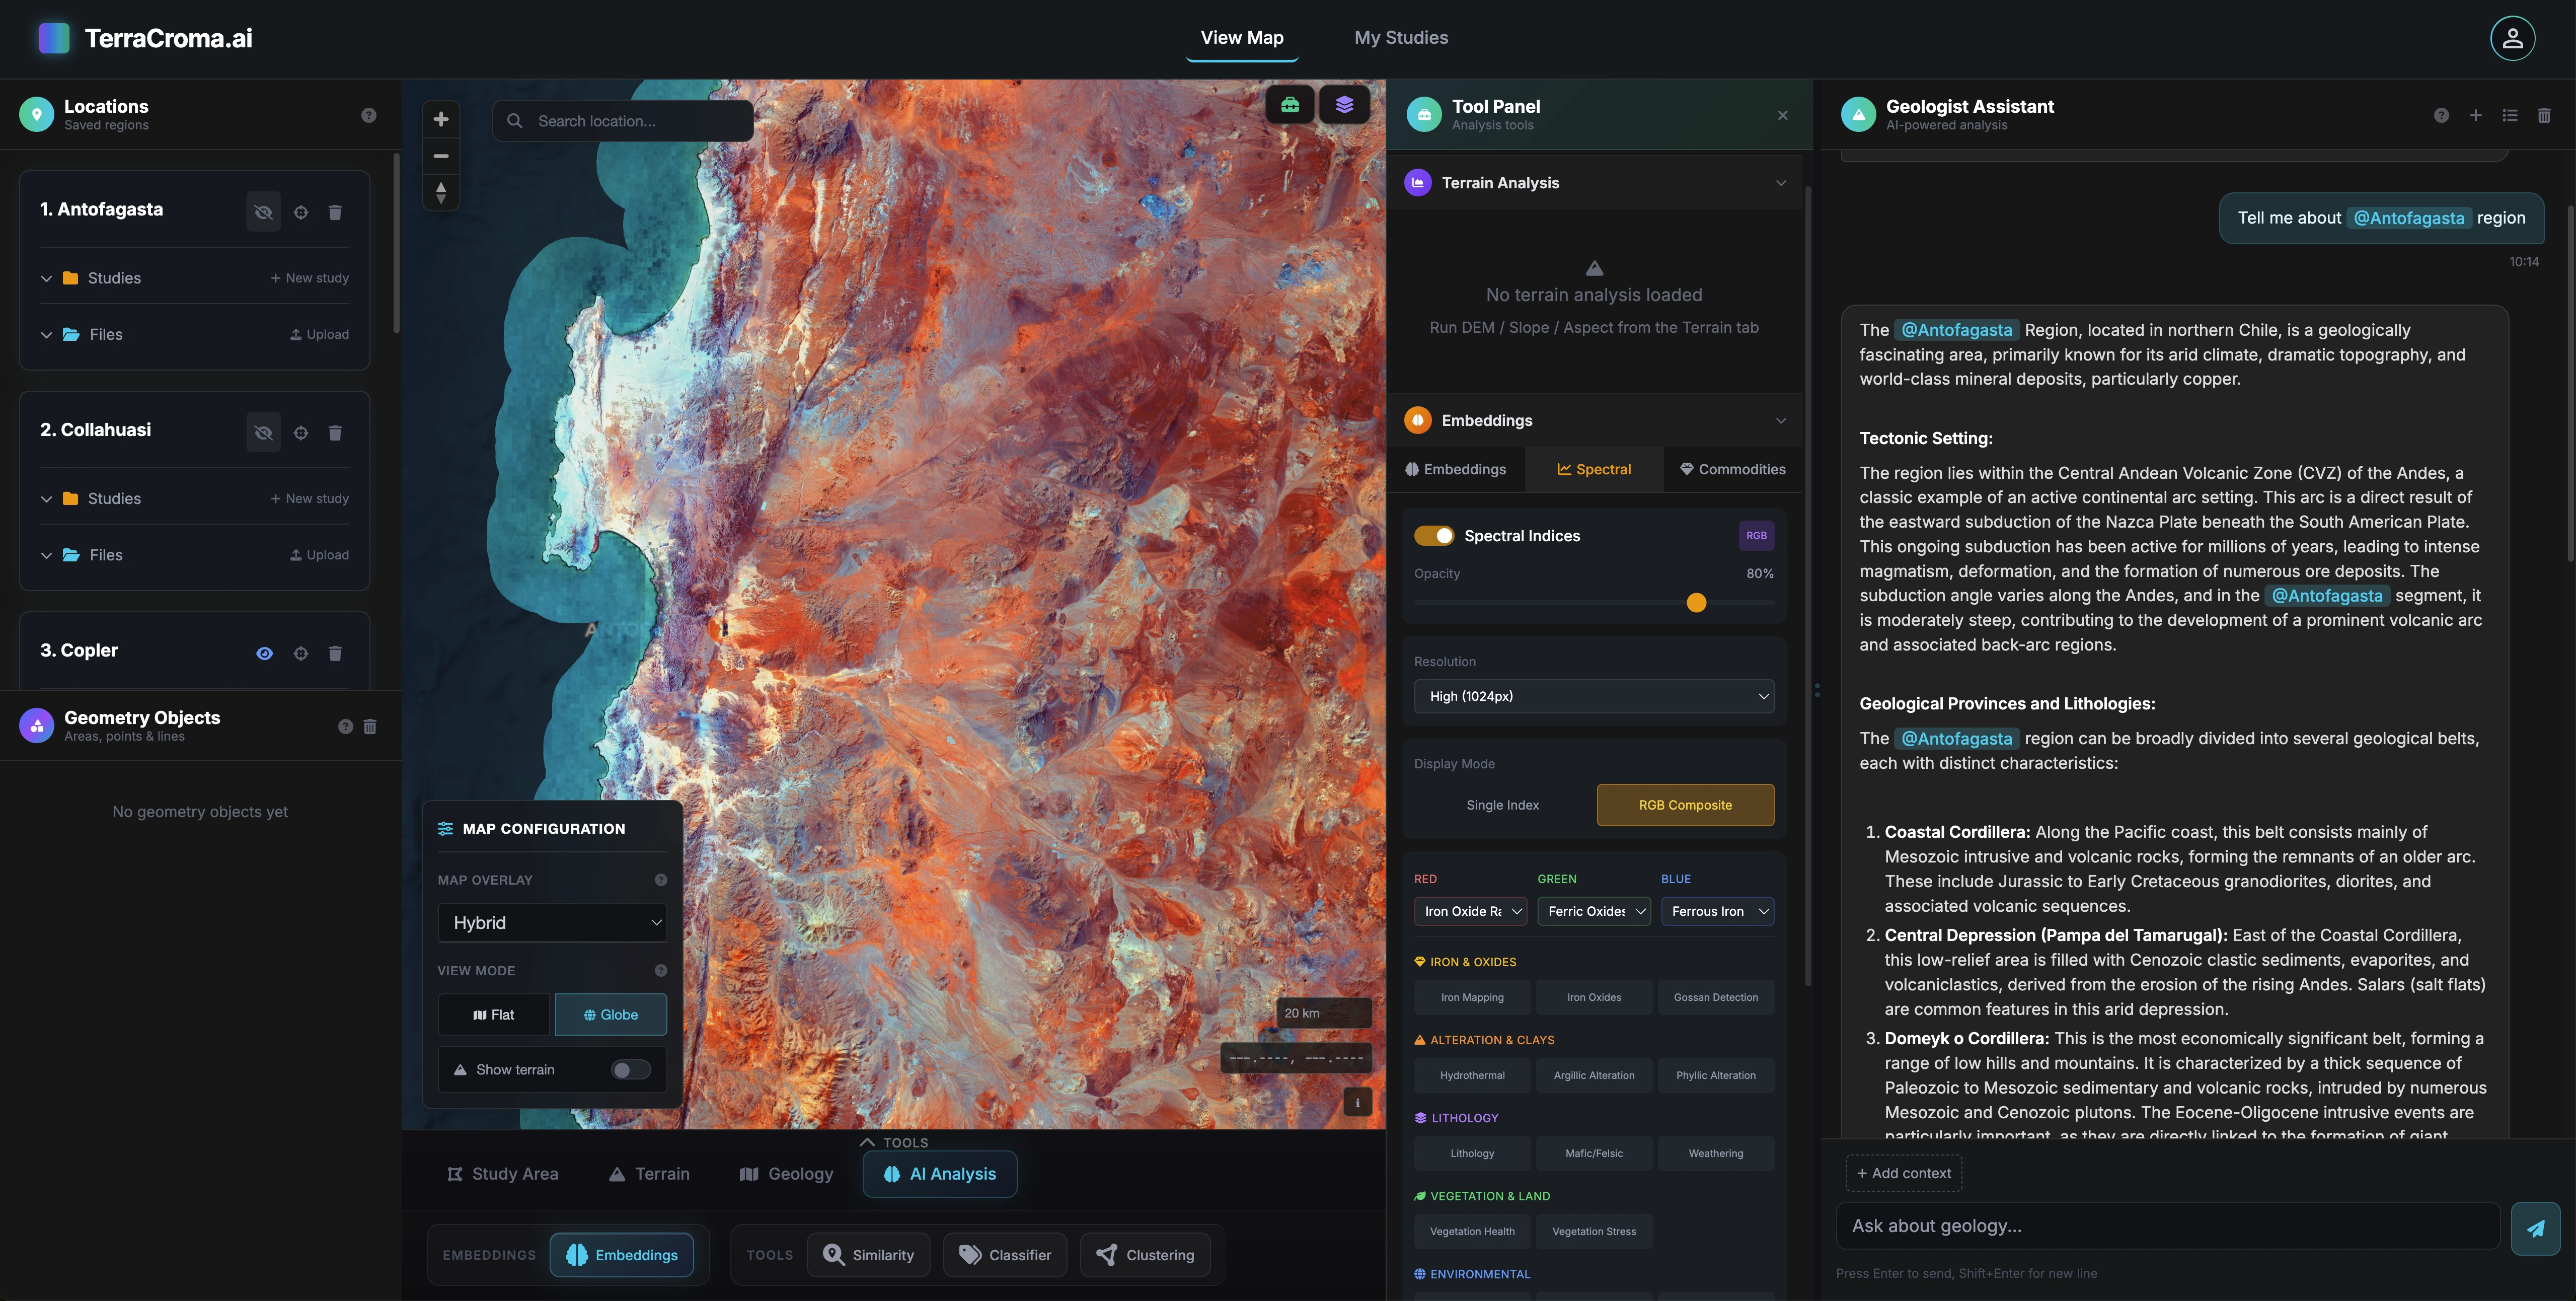
Multi-step assistant

Multi-step reasoning

One conversation chains shapes, indices, deposit queries and report generation.
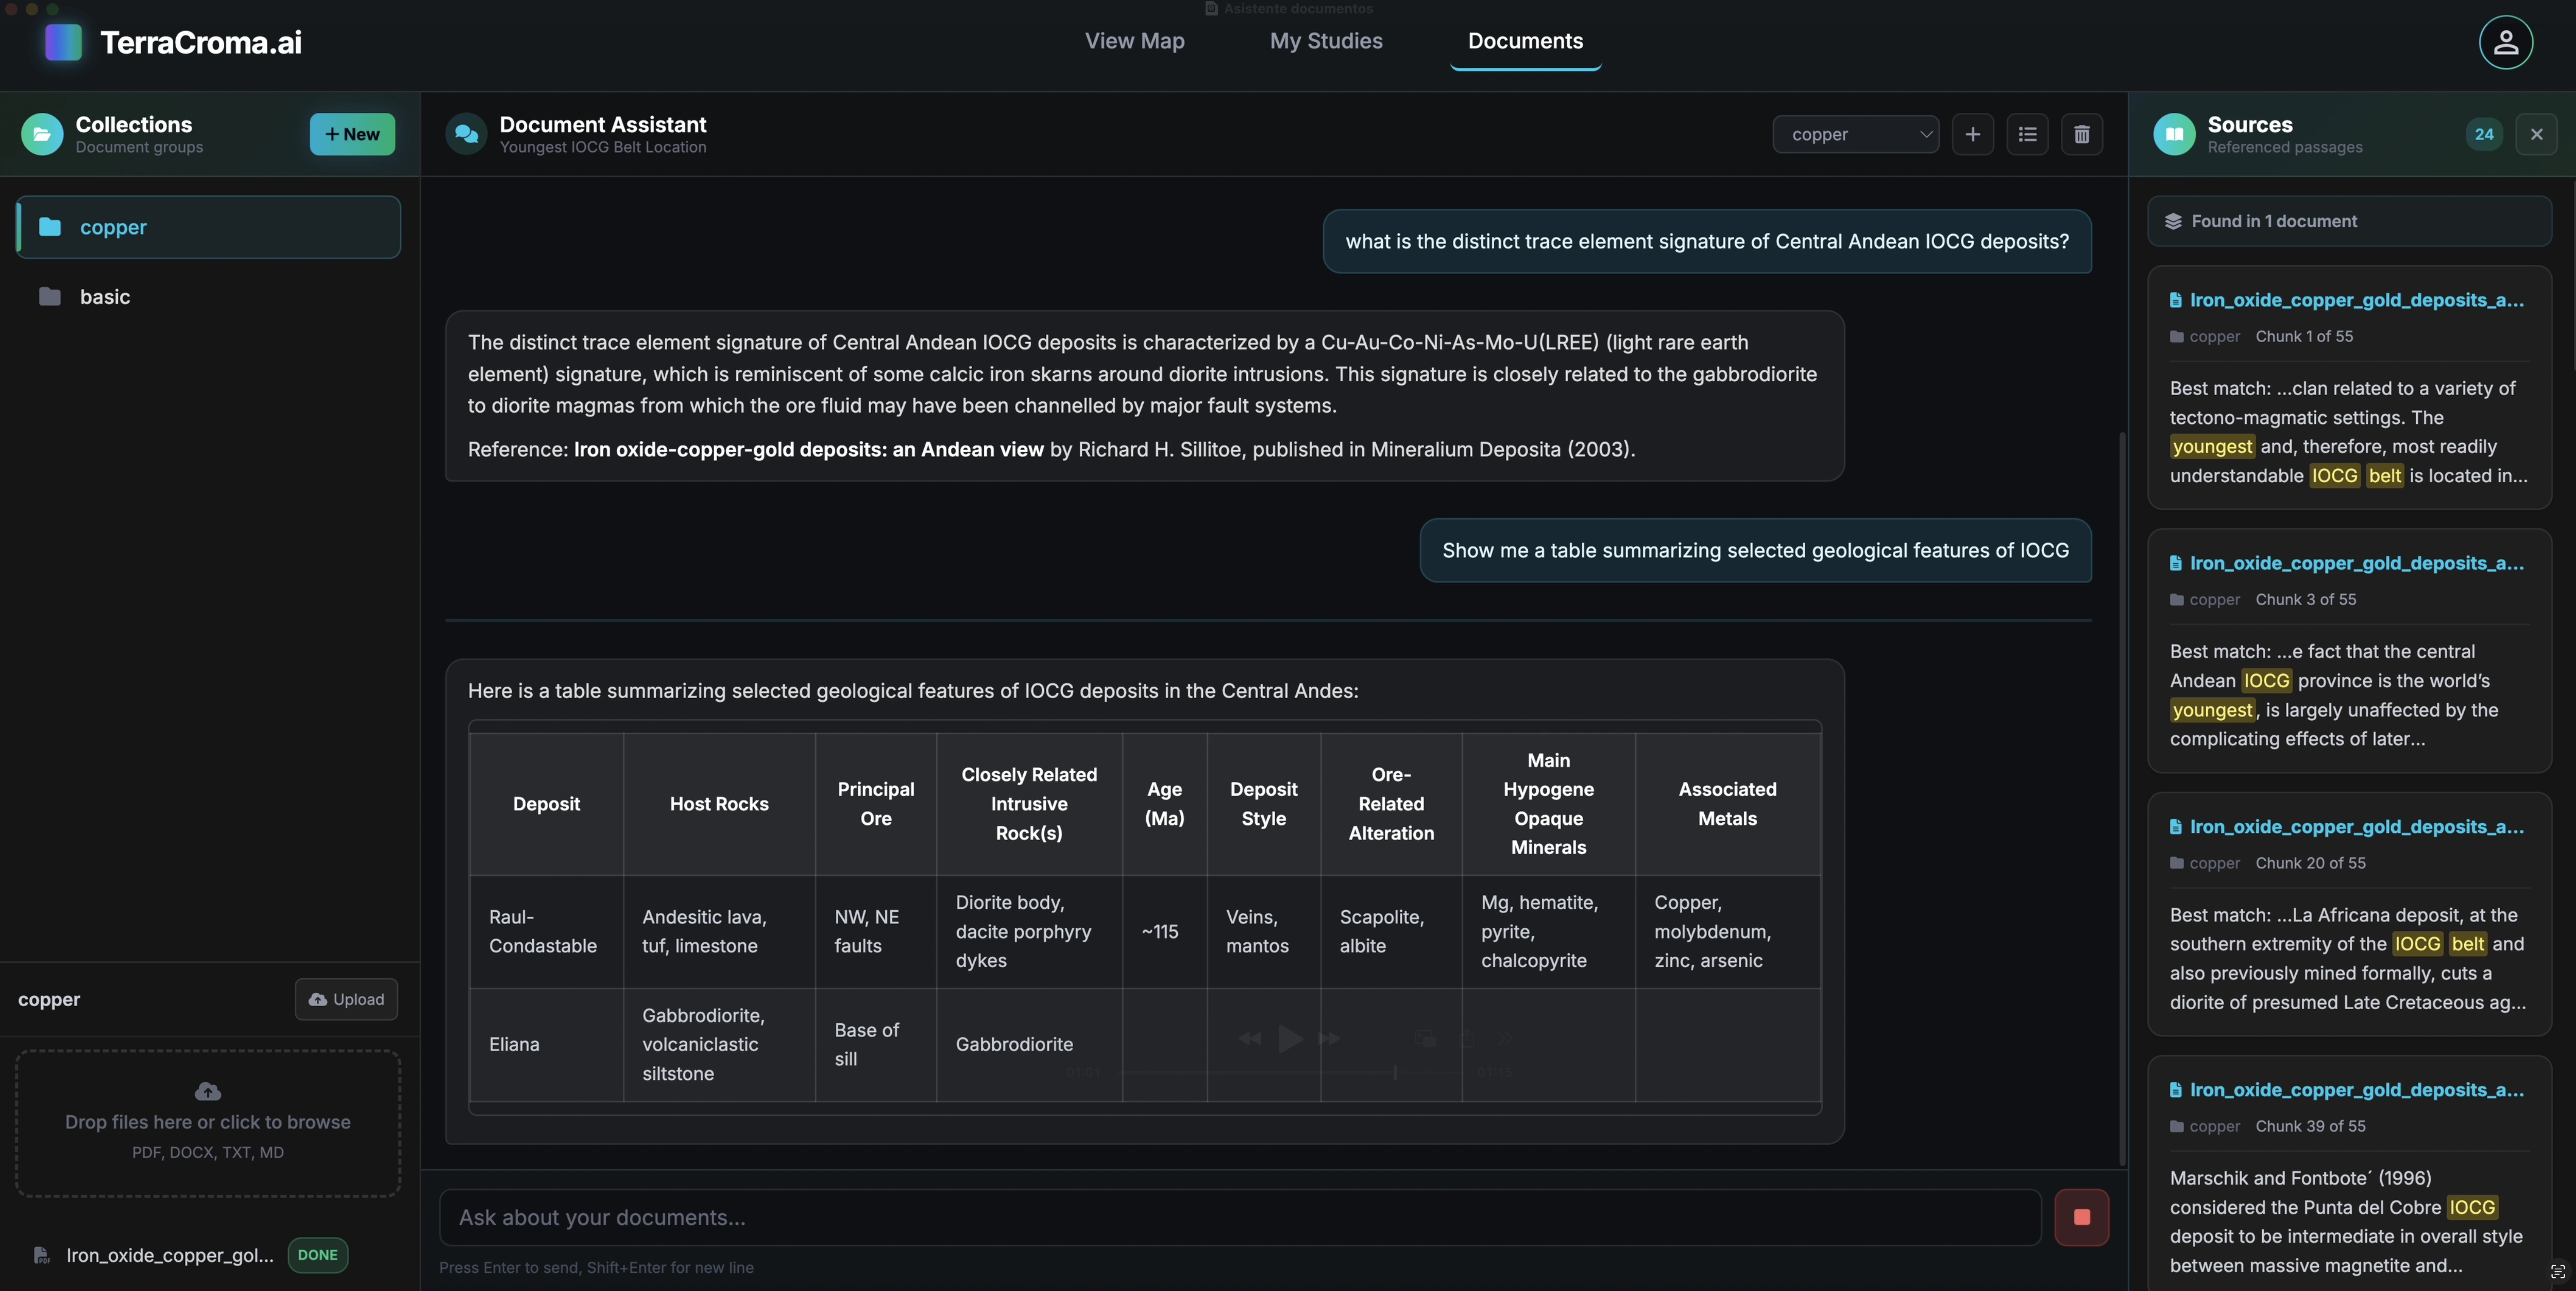
Document context

Bring your documents

Drop in drilling logs, field notes or geological sketches. They become part of the conversation.

Tool orchestration, not chat

Spectral indices, geometry, prospectivity, deposit queries, cross-sections, map captures, chained into a single workflow from one prompt.

Persistent conversations

Every session is saved with full context: viewport, active study, layers loaded, so you can pick up exactly where you left off.

Multi-modal input

Drop in an outcrop photo, a drilling log or a geological sketch. The assistant reasons over imagery and text together.

Pluggable LLM backbone

Frontier models behind the scenes. Swap providers without changing the workflow.

Multi-step reasoning

From one instruction to a complete geospatial workflow.

Tell the assistant what you want. It picks the right tools, sets parameters, runs them in the right order, and explains the result — all from a single natural-language prompt.

Example prompt

"Find iron-oxide alteration within 5 km of mapped faults in this district and rank the overlap by area."

01
Prompt

User states the goal in plain language — no menu-diving, no manual tool selection.

02
AI plan

Assistant decomposes the request, picks the right tools, sets parameters, orders the workflow.

03
Tool chain

Tools run together, each output flows into the next:

Iron-oxide index Load faults 5 km buffer Intersect Rank by area
04
Answer

Annotated map with ranked target zones, citations to the data layers used, ready to refine.

Or try prompts span every block
Block 02 · Geotechnics

"Show me everywhere this slope has moved more than 3 cm since 2022."

Block 03 · Exploration

"Compare this outcrop's spectral signature to the rest of the district."

Block 04 · Vision

"Alert me whenever a vehicle crosses Zone B outside working hours."

Cross-cutting · Documents

"Search drilling logs for any mention of porphyry-style alteration here."

For enterprises On-premise Air-gapped

Chat with all your private documents and databases,
on your own infrastructure, with no cloud uploads.

The same assistant that runs the geological workflow, deployed inside your network, can query your private documents and internal databases — geological reports, drilling logs, internal surveys, historical archives and enterprise records — in natural language, with grounded answers and citations.

Your data never leaves your infrastructure. Built for mining enterprises that can't send proprietary exploration data to external APIs. Self-hosted models, per-team access control, full audit trail.

Private document workspace

Document Q&A, grounded on your corpus

Ask about any drilling log, report or survey. Answers come back with citations to the source documents.

Local deployment

Self-hosted models. Your servers. Air-gapped option available.

Data sovereignty

Documents never leave your servers. Zero third-party API calls. Per-team access control.

Custom corpus

PDFs, drilling logs, scanned maps & reports: indexed and searchable in natural language.
02

Block 02 · Operational domain

Geotechnics & Terrain Stability

Detect, classify and monitor terrain movement before it becomes a failure. Continuous centimeter-scale monitoring of dams, tailings, slopes and pit walls — backed by predictive AI trained on displacement time series, fused with field instrumentation.

Hazard Monitoring · InSAR

Catch hazardous movement before it becomes a failure.

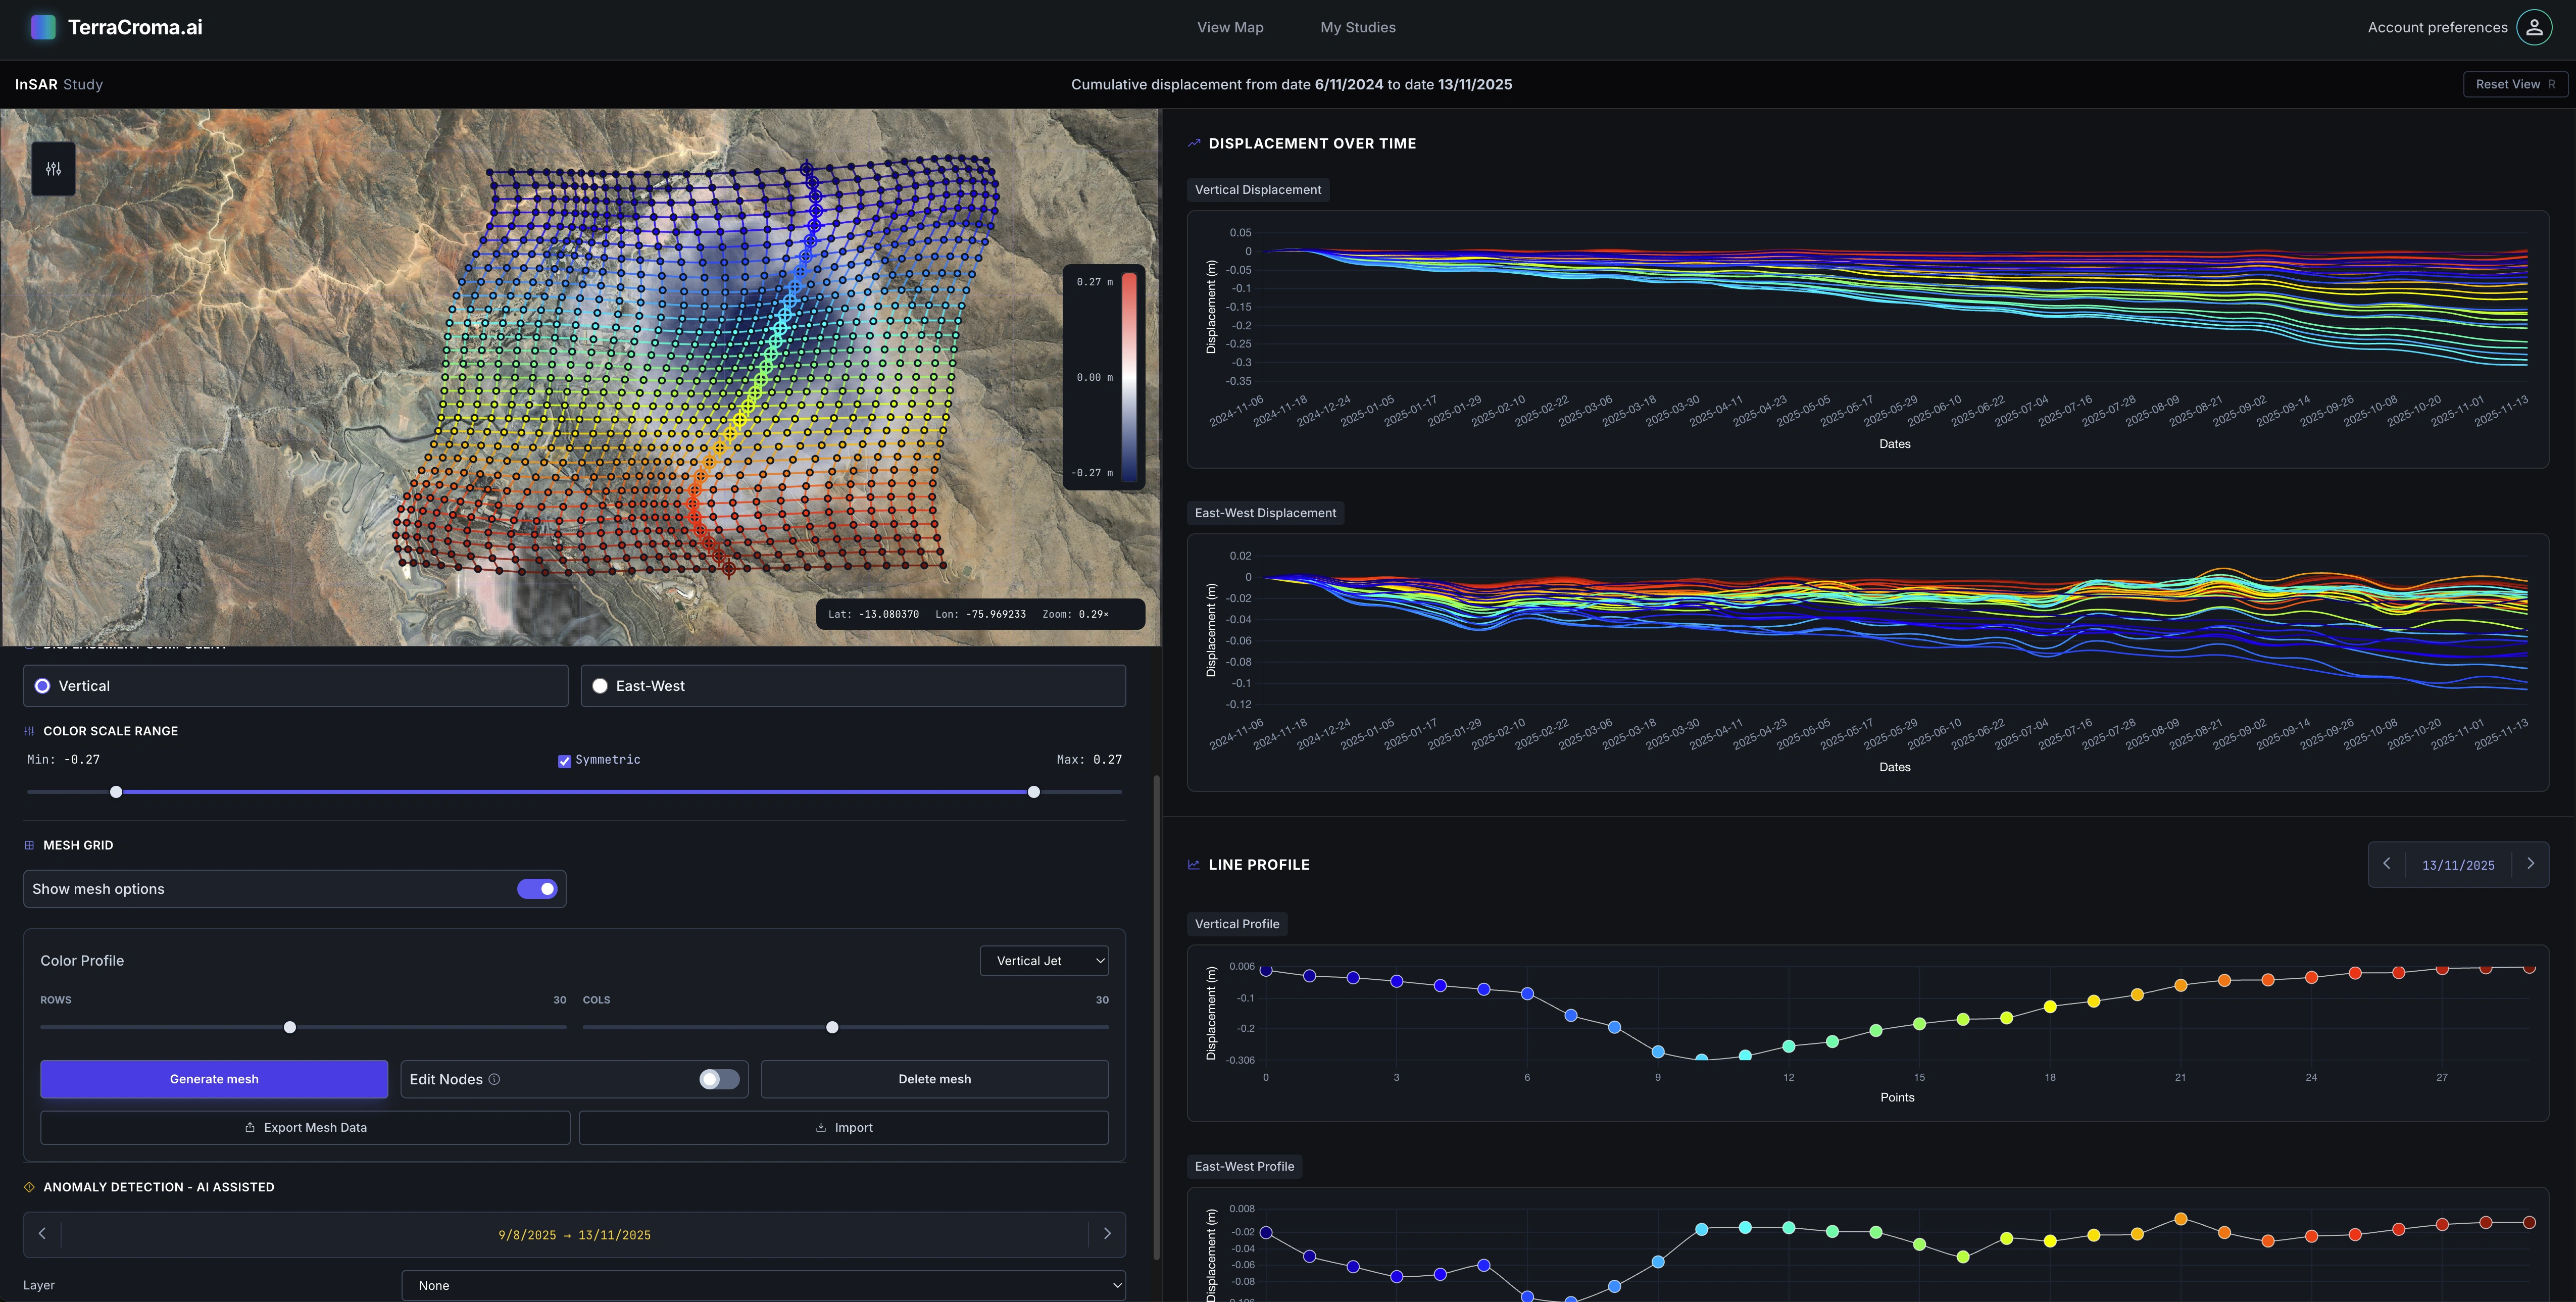
Continuous centimeter-scale monitoring of dams, tailings facilities, slopes and pit walls. Predictive models trained on displacement time-series flag hazardous trends before they accelerate: turning incident response into prevention. Behind the scenes, the SBAS pipeline tunes to your site's geology and climate.

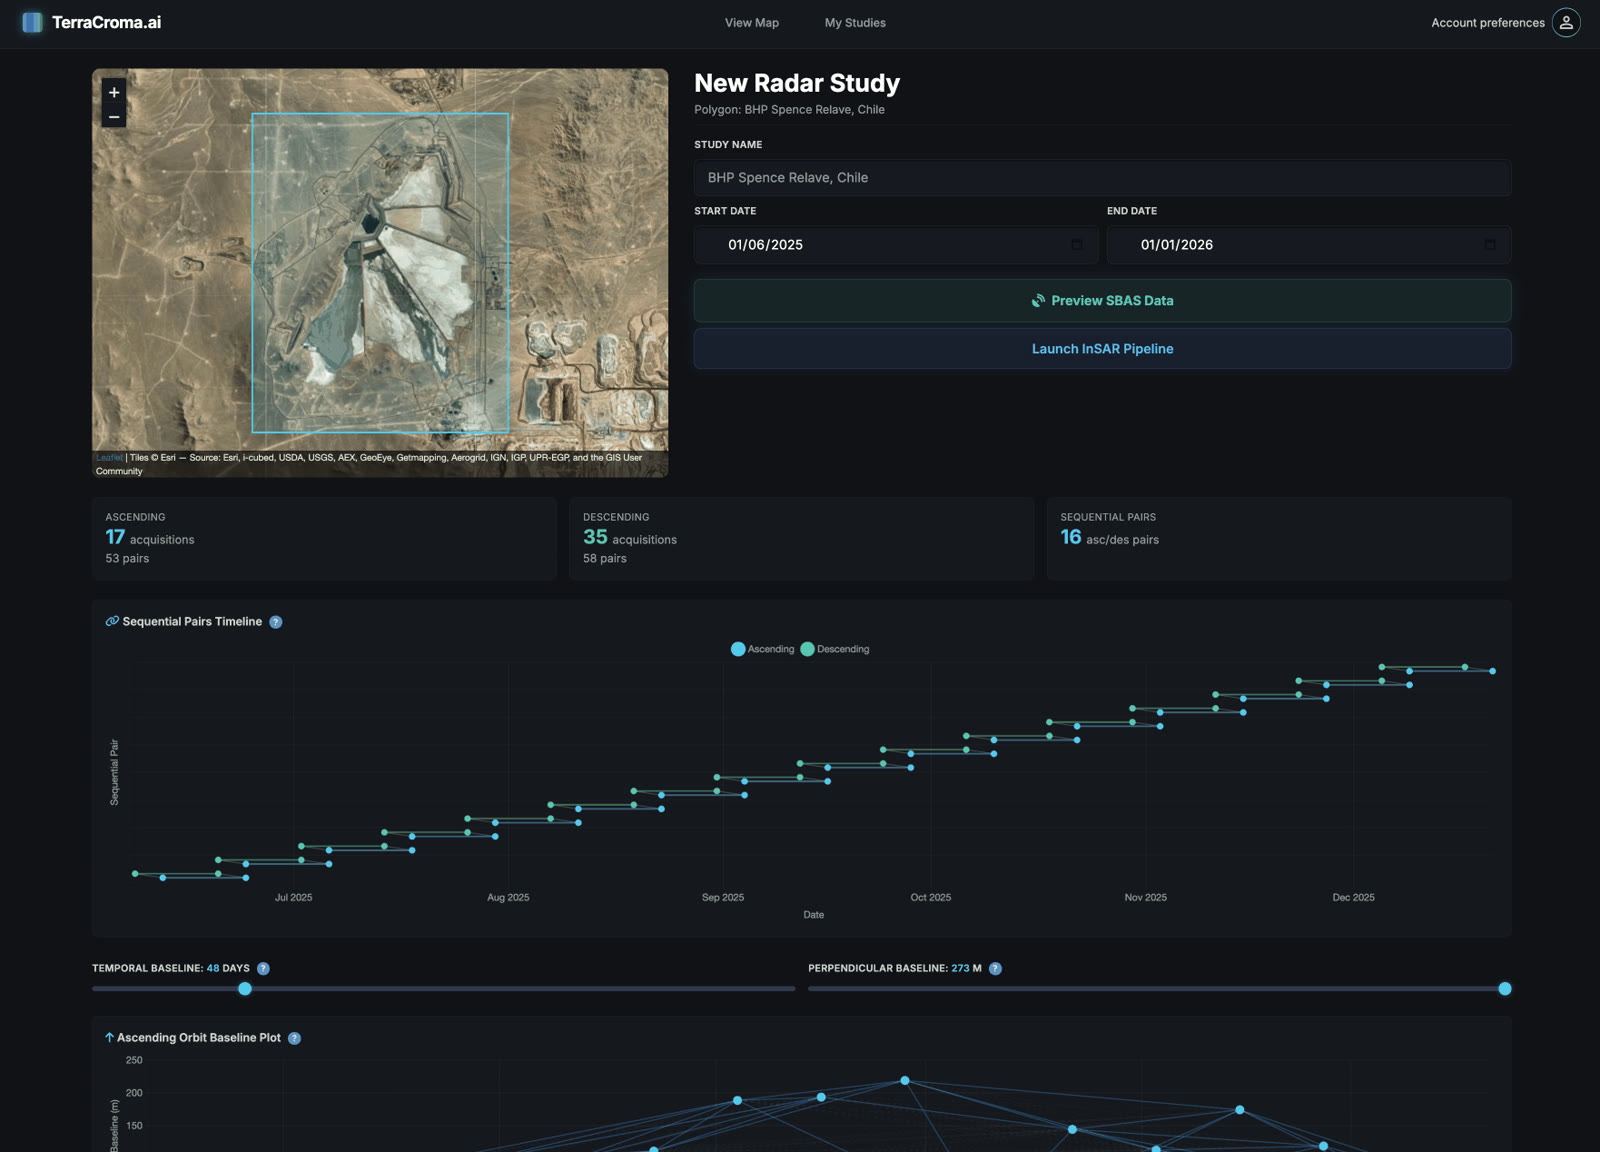
SBAS InSAR, tuned to your site

Customize Small Baseline Subset parameters: perpendicular and temporal baseline thresholds, coherence cutoffs, reference-point selection. Then watch months of centimeter-scale displacement unfold frame by frame.

Differential InSAR

Differential InSAR

Phase differences between two passes, with coherence quality alongside.

Centimeter-scale displacement

Subsidence, slope movement and structural drift detected from orbit.

Predictive risk models

Proprietary AI trained on displacement time-series detects hazardous trends in dams, tailings, slopes and pit walls before they accelerate, giving operators time to act.

Coherence as a quality layer

Know where the signal is reliable before you draw conclusions.

Geocoded outputs

CRS metadata and crop bounds preserved. Drop straight into your GIS stack.

Public & private studies

Hash-based sharing for stakeholder reports; full privacy by default.

AI · Predictive risk models

AI that flags hazardous behavior before it accelerates.

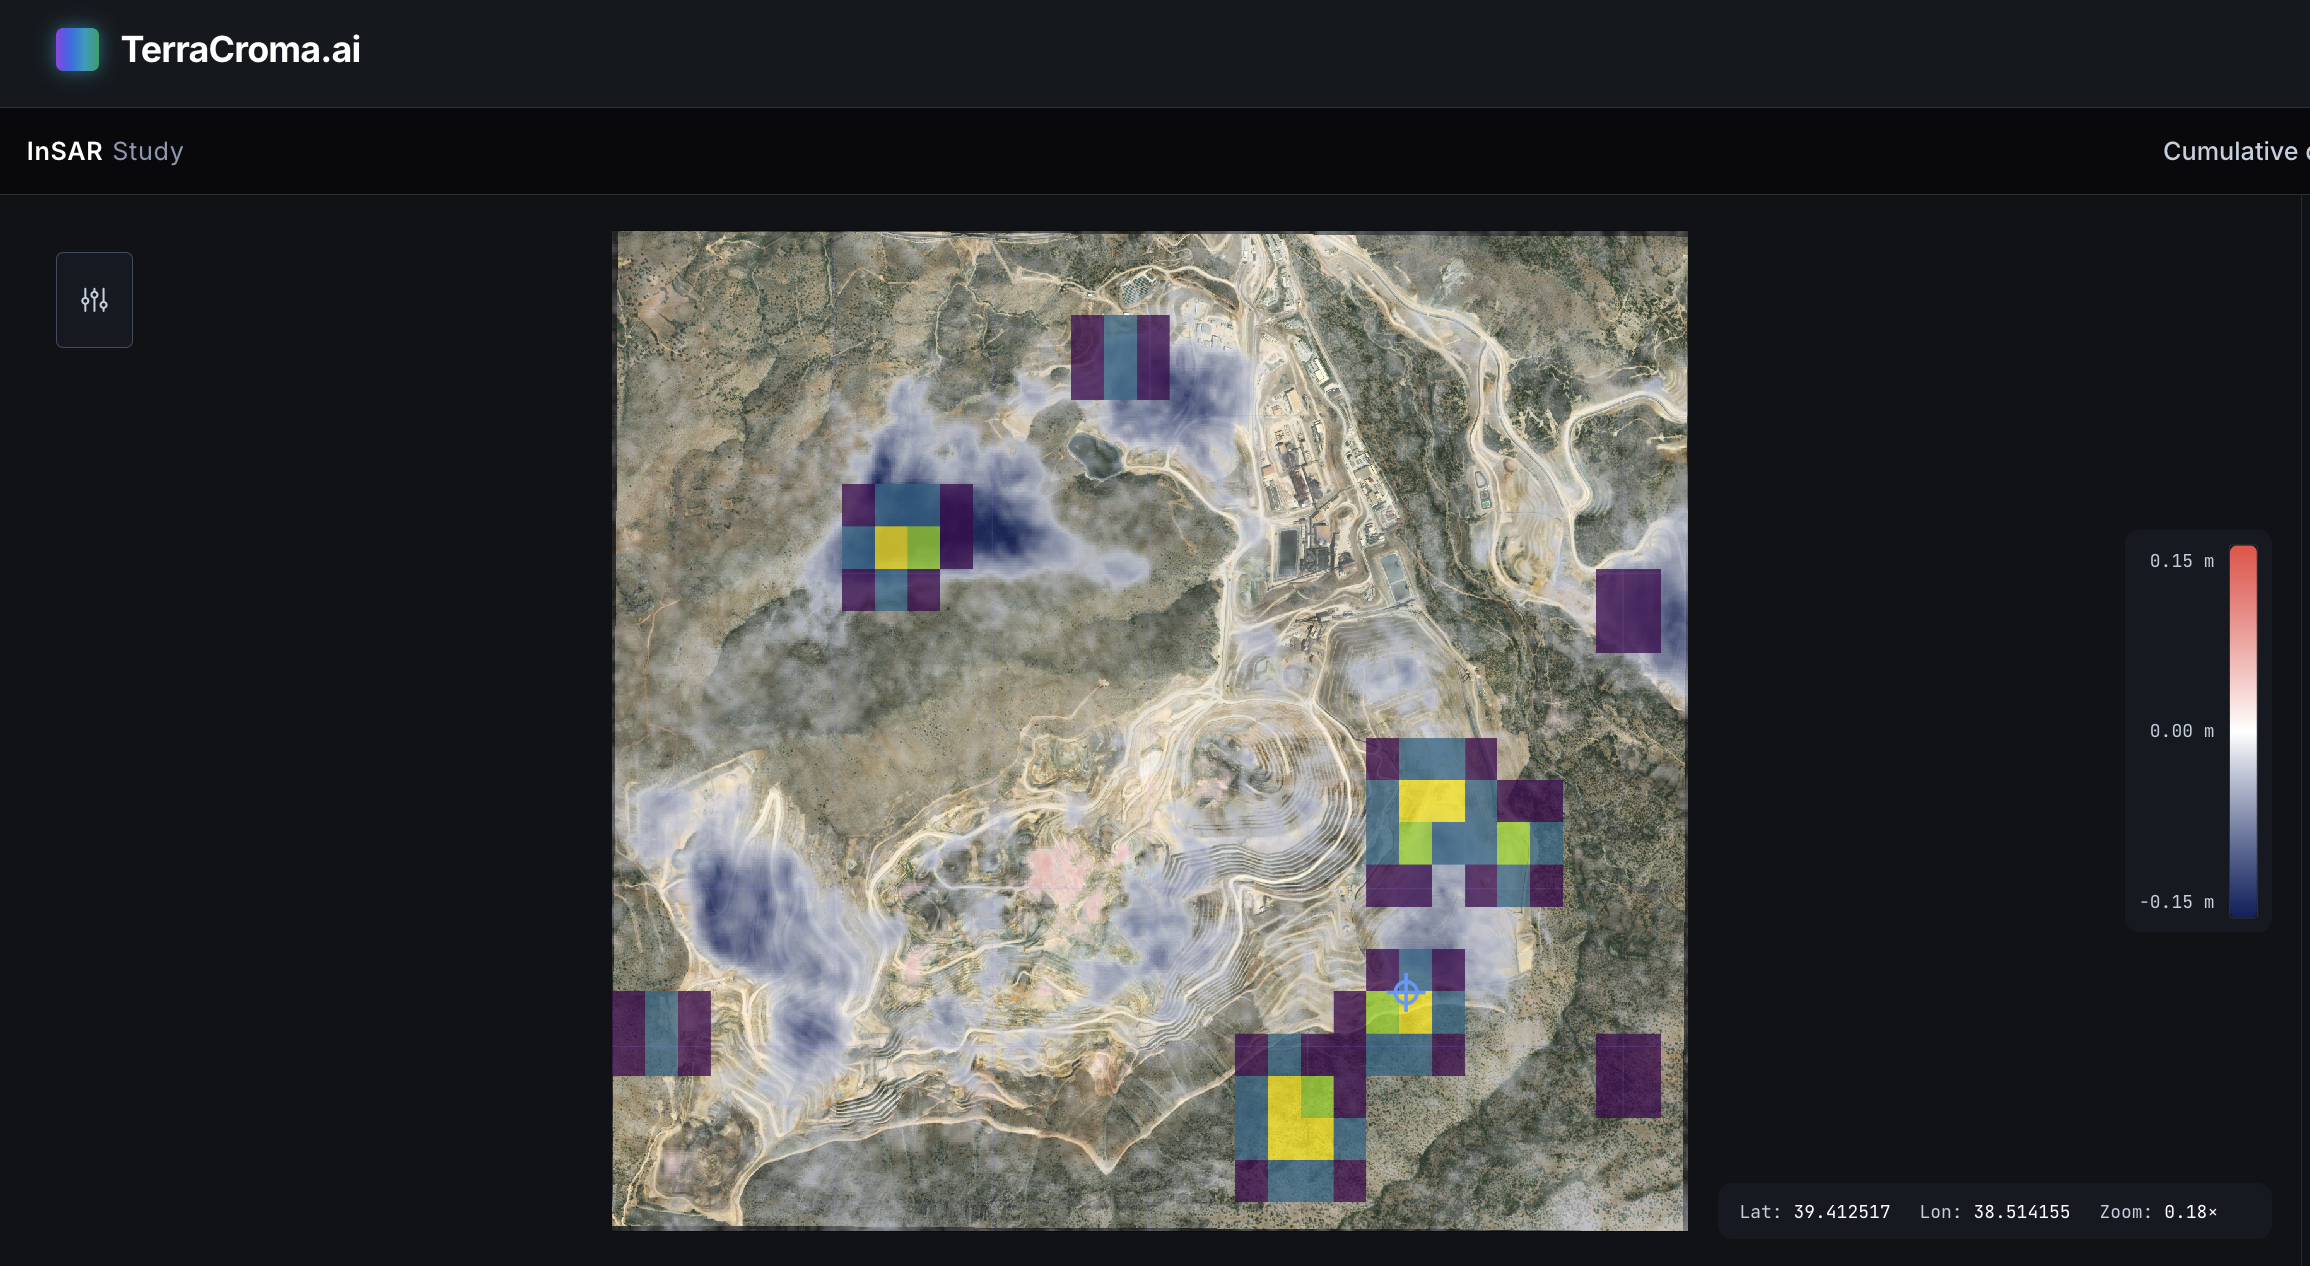
Proprietary models trained on centimeter-scale displacement time-series detect hazardous deformation patterns in dams, tailings facilities, slopes and pit walls, classifying movement type and flagging anomalies automatically.

The output: a clear risk classification per surface, served as a layer next to your spectral and geological data, so operators see where to act, and when, without parsing raw phase data.

AI hazard classification on InSAR

AI risk classification

Predictive model output over an InSAR displacement scene: hazardous areas identified, ranked and explained.

InSAR walkthrough

A complete demo of the workflow, from configuration to displacement maps.

Use case · Tailings dam

End-to-end monitoring for tailings dams:
Terrain stability and composition

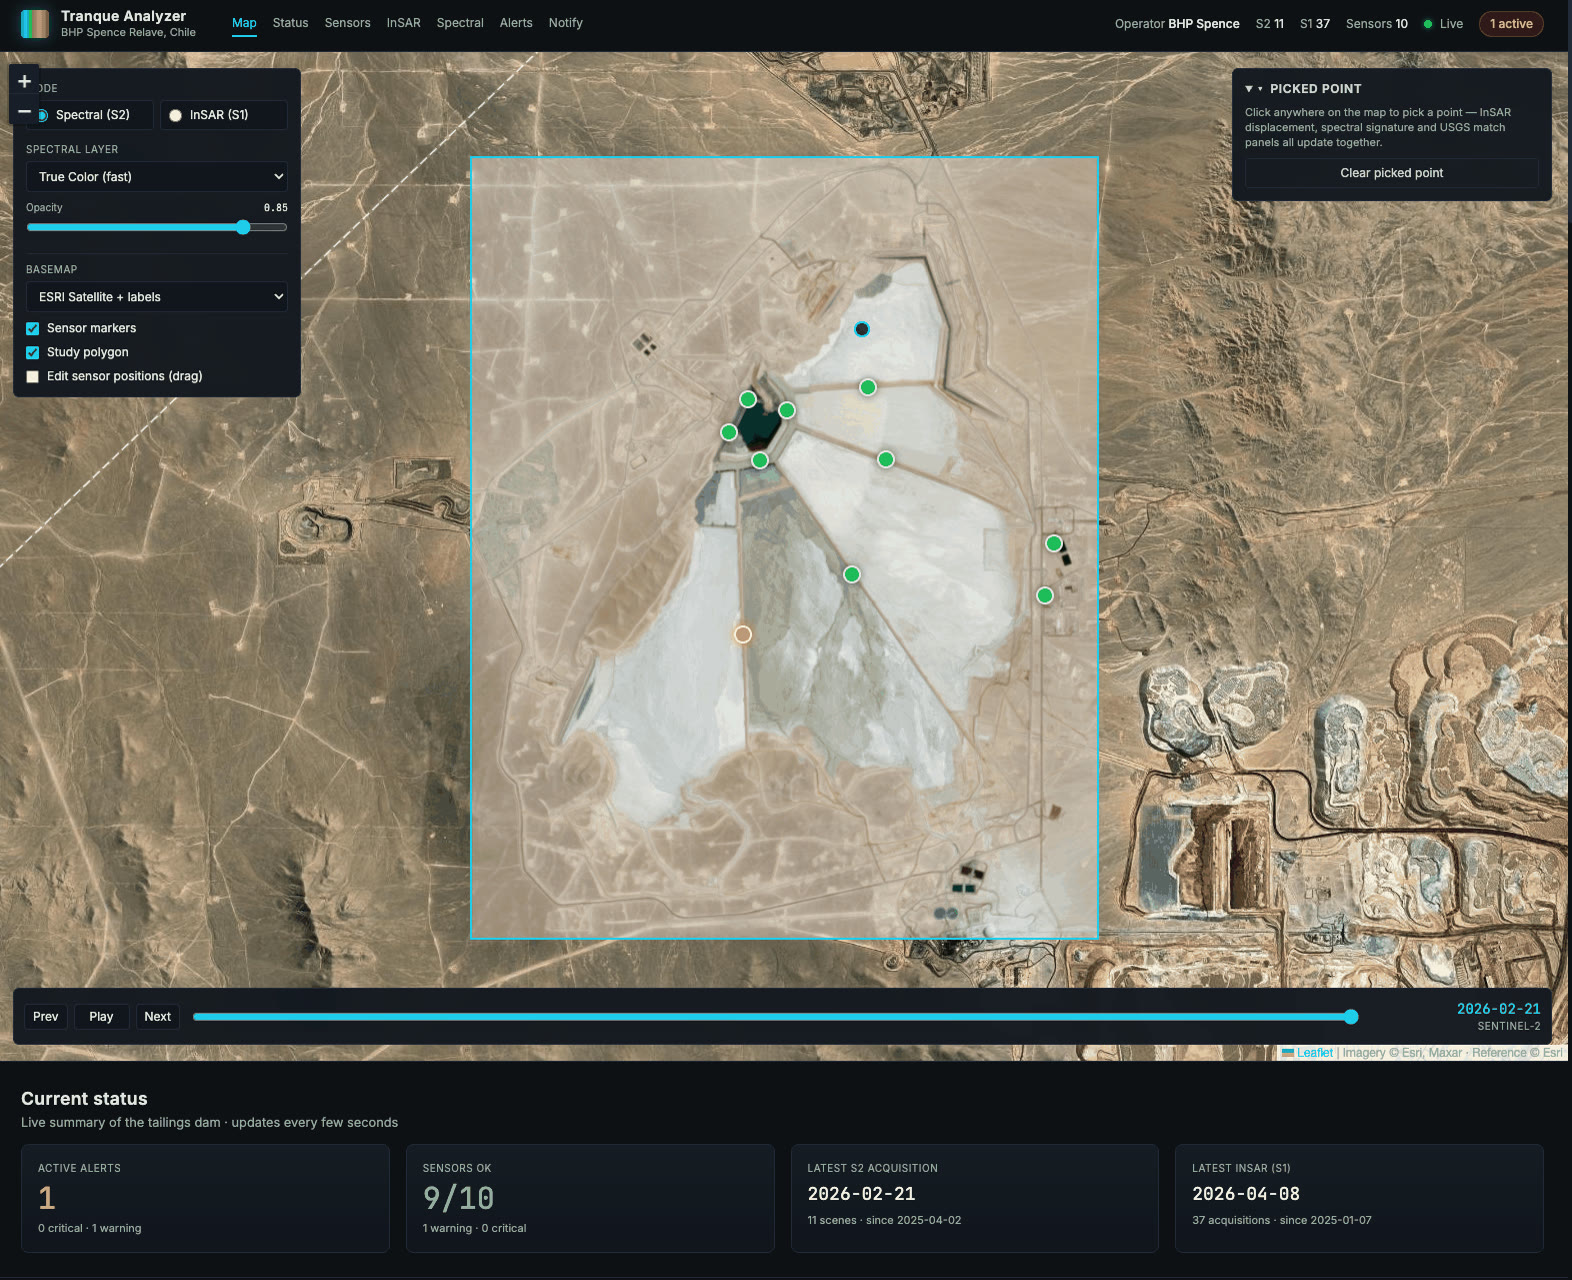
Connect the field instrumentation already on your tailings dam: piezometers, inclinometers, accelerometers, weather stations, water-level gauges. Stream their data alongside InSAR displacement and spectral indices in a single dashboard.

Cross-check satellite signals against ground-truth measurements, define multi-modal alert rules, and give operations one source of truth for the integrity of every dam, without replacing the systems you already trust.

Sensor integration

Piezometers, inclinometers, accelerometers, weather and water-level, via your existing SCADA / IoT stack.

InSAR + spectral overlay

Satellite displacement and surface alteration zones rendered alongside ground-truth sensor data.

Multi-modal alerts

Trigger when sensor and satellite signals corroborate, routed to your incident system or on-call rotation.

Unified tailings dam dashboard

Field sensors + InSAR displacement + spectral indices in one view, with alert rules across modalities.

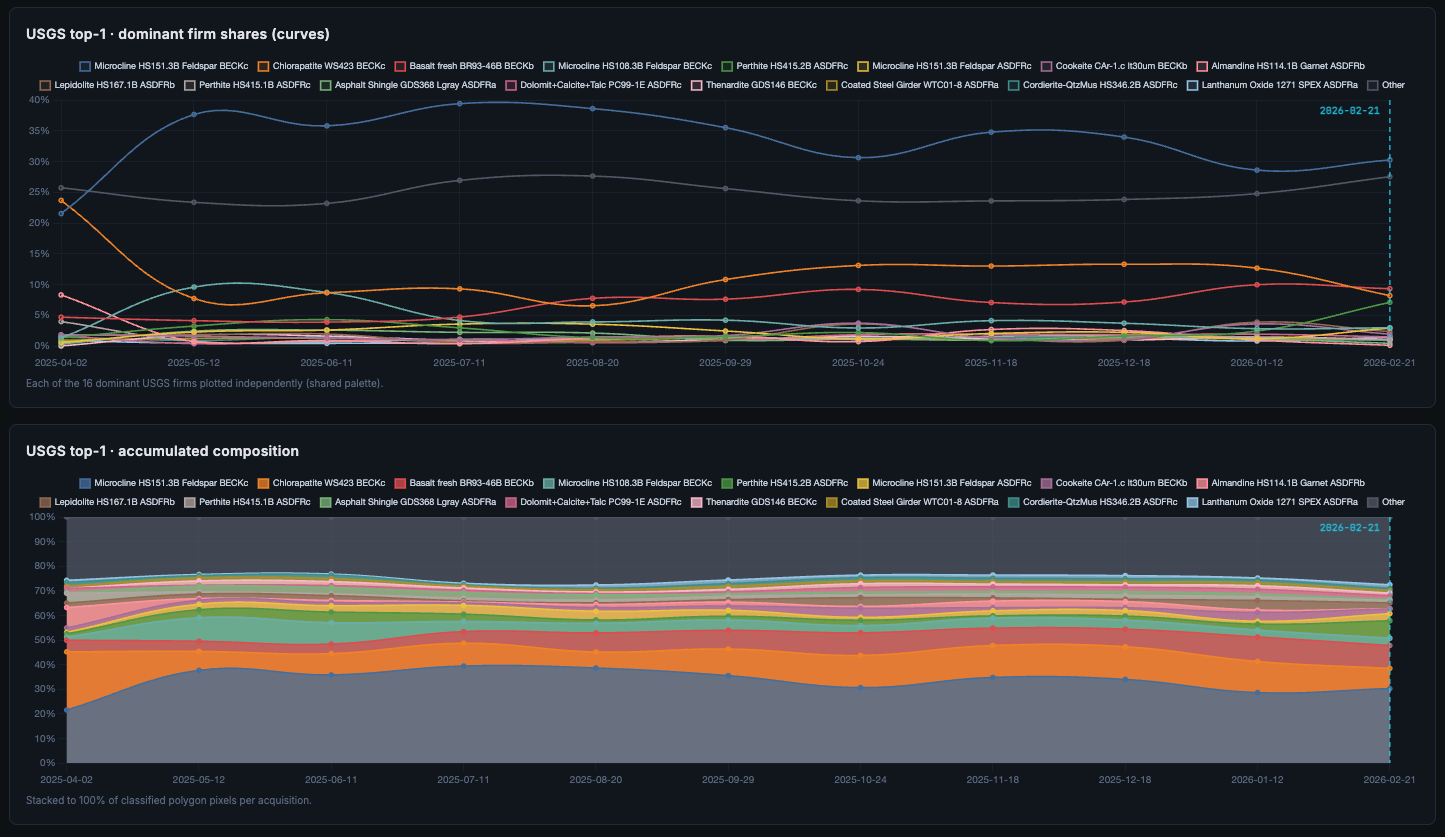
Spectral composition over tailings dam

Spectral composition overlay

Surface alteration and mineralogy zones rendered over the dam. Spot tailings spread, water content shifts and unstable surface materials at a glance.

Complementary monitoring layers

Ground radar sees the critical area. InSAR sees the broader context.

TerraCroma complements ground radar — it does not replace it. Used together, the two layers cross-validate each other and give operators a complete picture.

On-site sensors

Ground radar & local sensors

Best for

  • High-frequency monitoring of critical zones
  • Operational alarms in known-risk areas
  • Real-time deformation at the asset

Wide-area satellite

TerraCroma InSAR layer

Best for

  • Wide-area coverage and remote zones
  • Historical and slow-moving trends
  • Regional comparison and context
+

When combined

Cross-validated anomalies · context around local alarms · multi-source confidence · better field-inspection prioritization.

03

Block 03 · Operational domain

Discovery & Exploration

From raw imagery to ranked, explainable targets. Spectral analysis, similarity search, geology, terrain, super-resolution and Bayesian prospectivity — every step feeds the next, ending in a calibrated probability map for the commodity you care about.

End-to-end target generation

A complete target-generation workflow — not a collection of isolated tools.

Six stages, each handing output to the next. The same workflow runs whether you're screening a basin or zooming in on a single concession.

01

Observe

Sentinel-2, terrain, historical imagery — pulled by polygon and date.

02

Enhance

AI super-resolution and RGB composites tuned for geology.

03

Interpret

Spectral fingerprints, geological maps, deposit databases.

04

Compare

Similarity search, unsupervised clustering, custom classifiers.

05

Model

Bayesian prospectivity that fuses every evidence layer.

06

Prioritize

Ranked, explainable targets. Reports, exports, share links.

03.1Mineral Prospectivity

Where to look next, weighted by evidence.

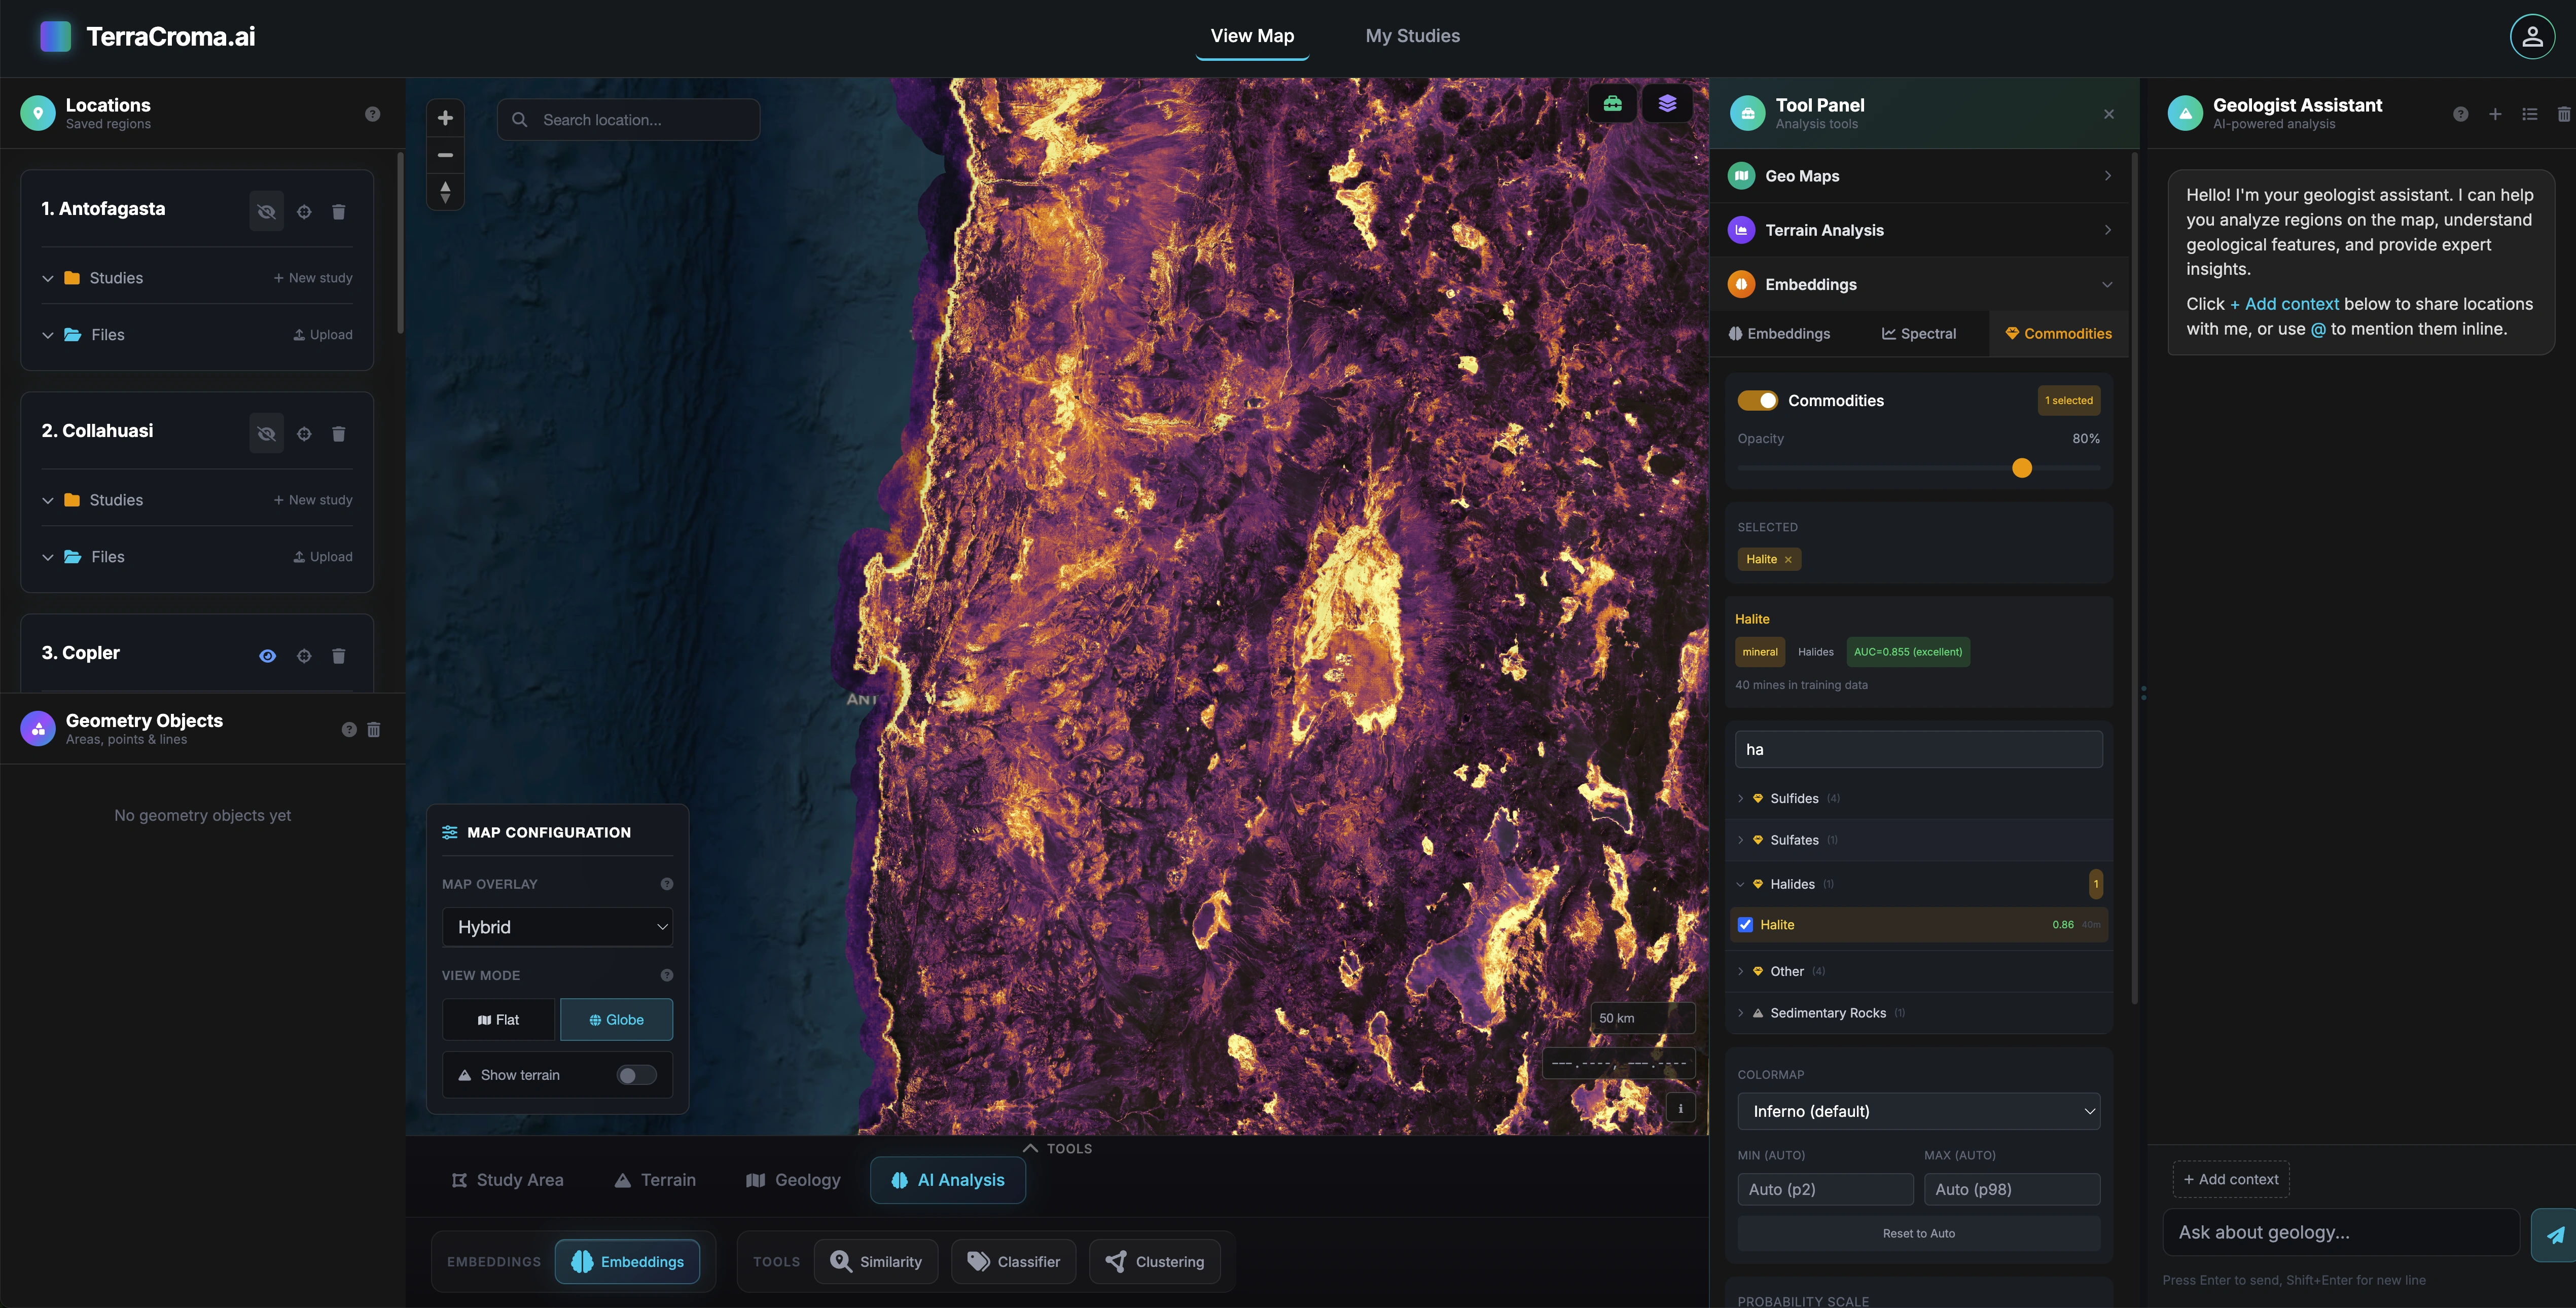
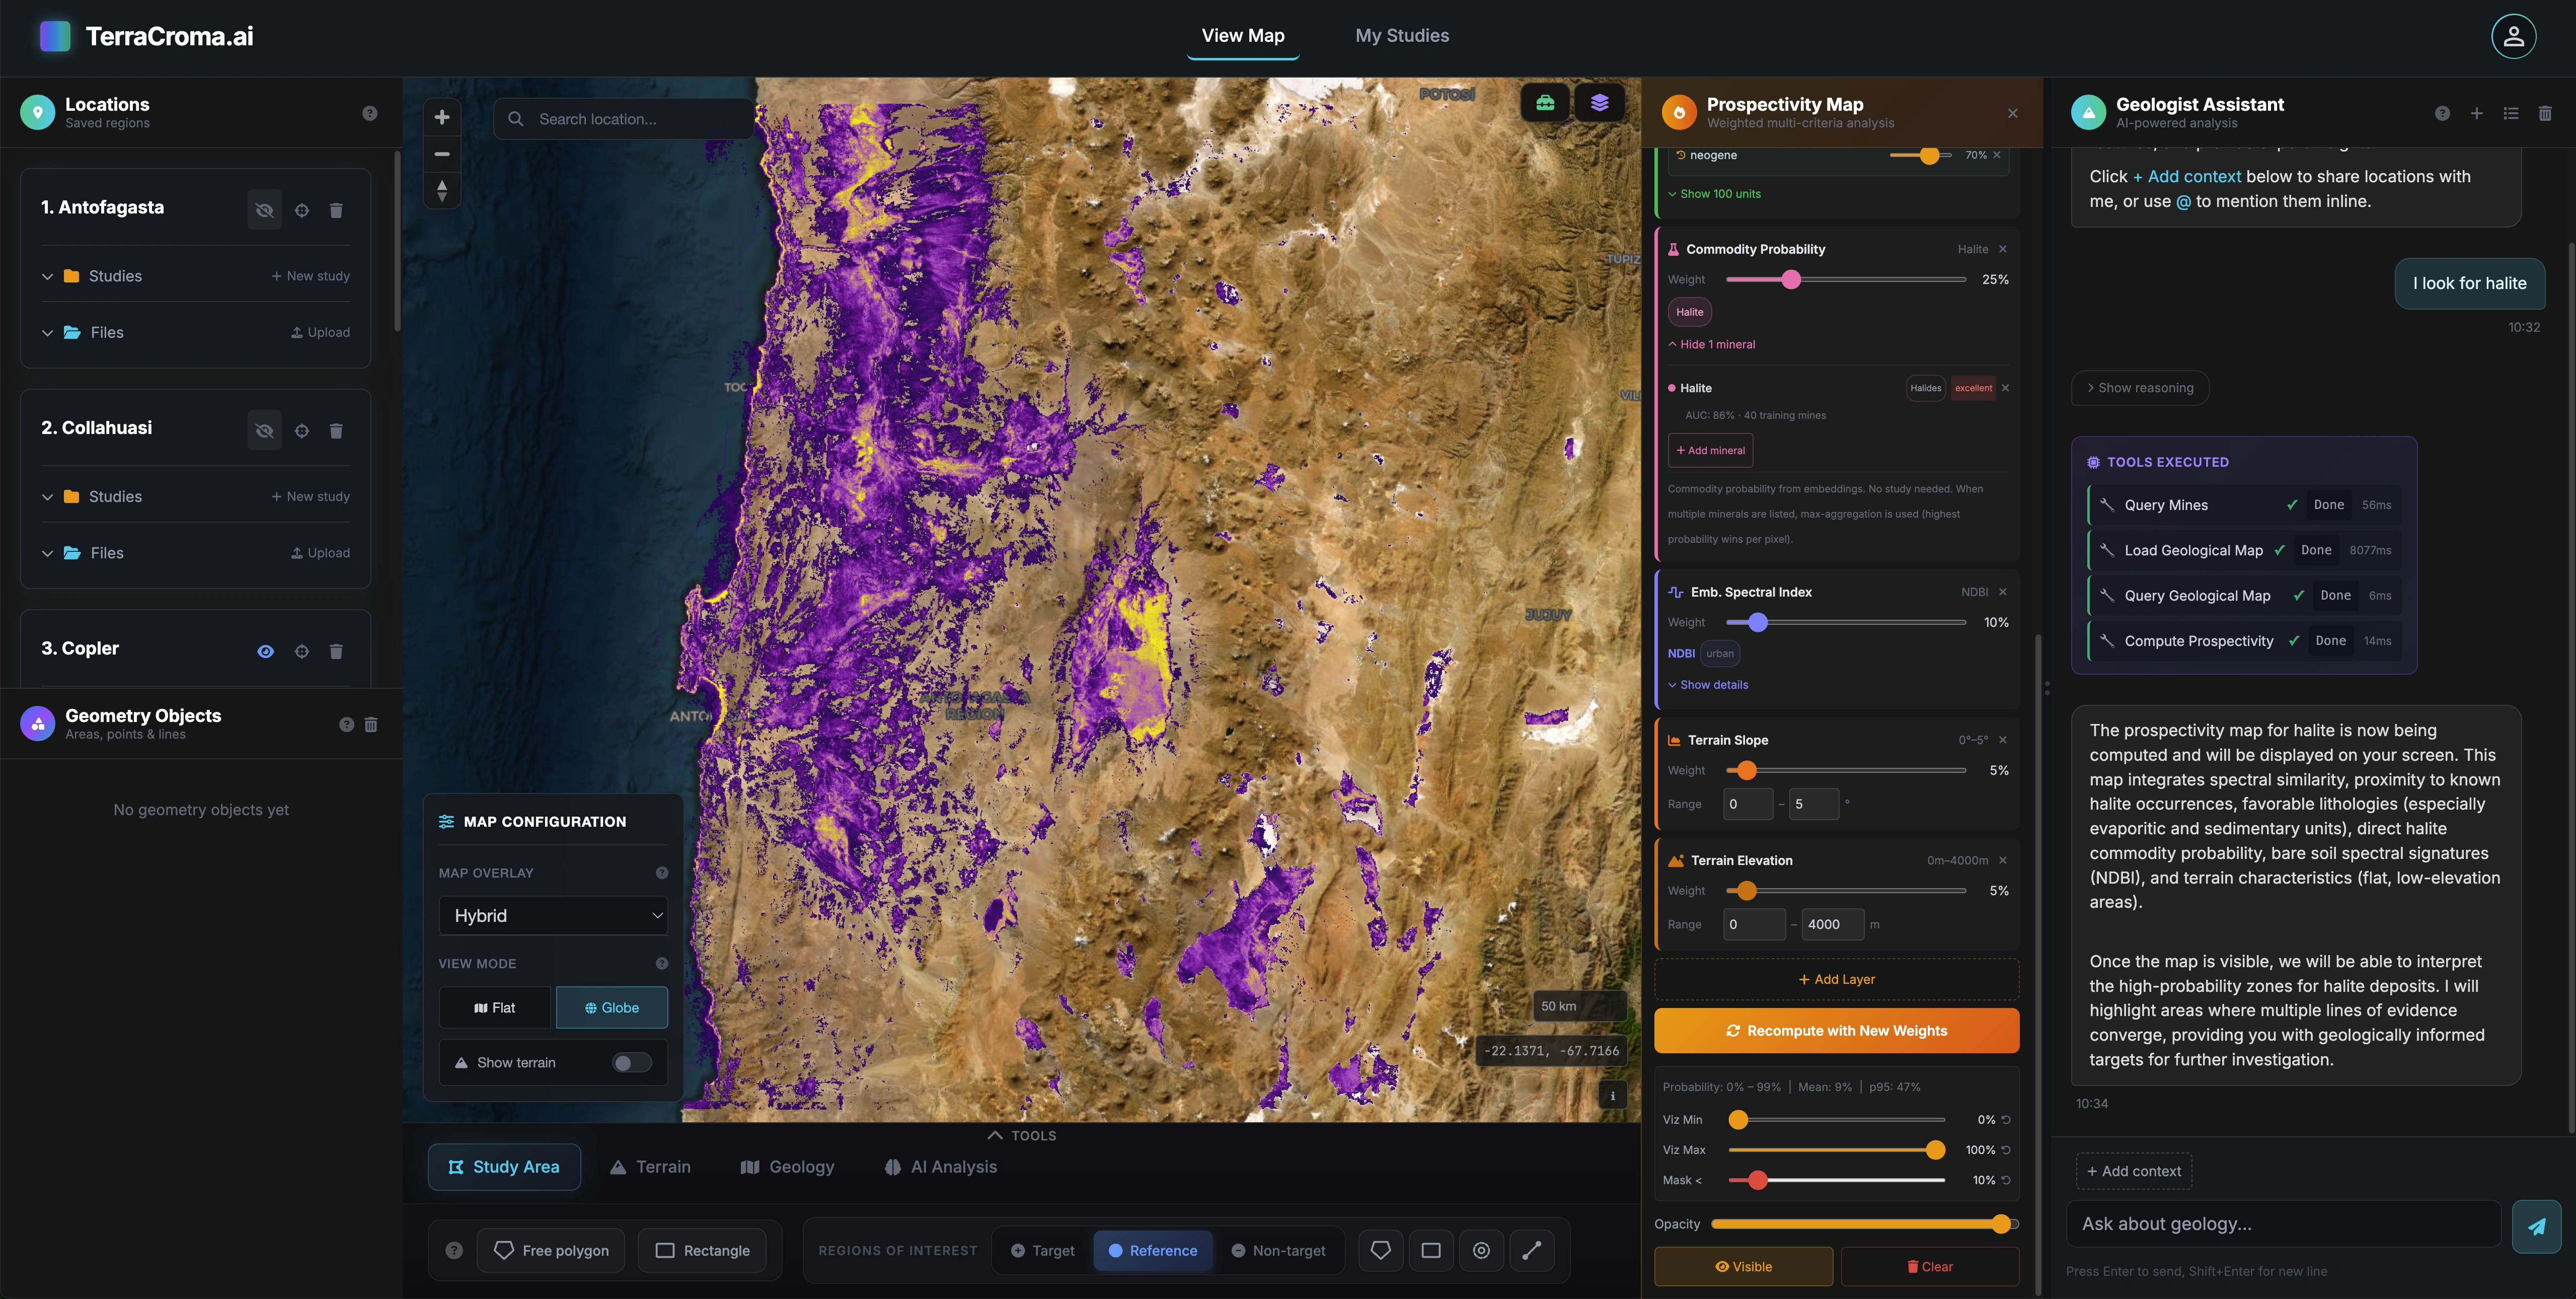
Bayesian fusion of ten or more evidence layers (spectral, geological, structural, topographic and proximity-based) into a single, calibrated favorability map. Tune priors, weight evidence, mark known occurrences, and let the platform rank ground for you.

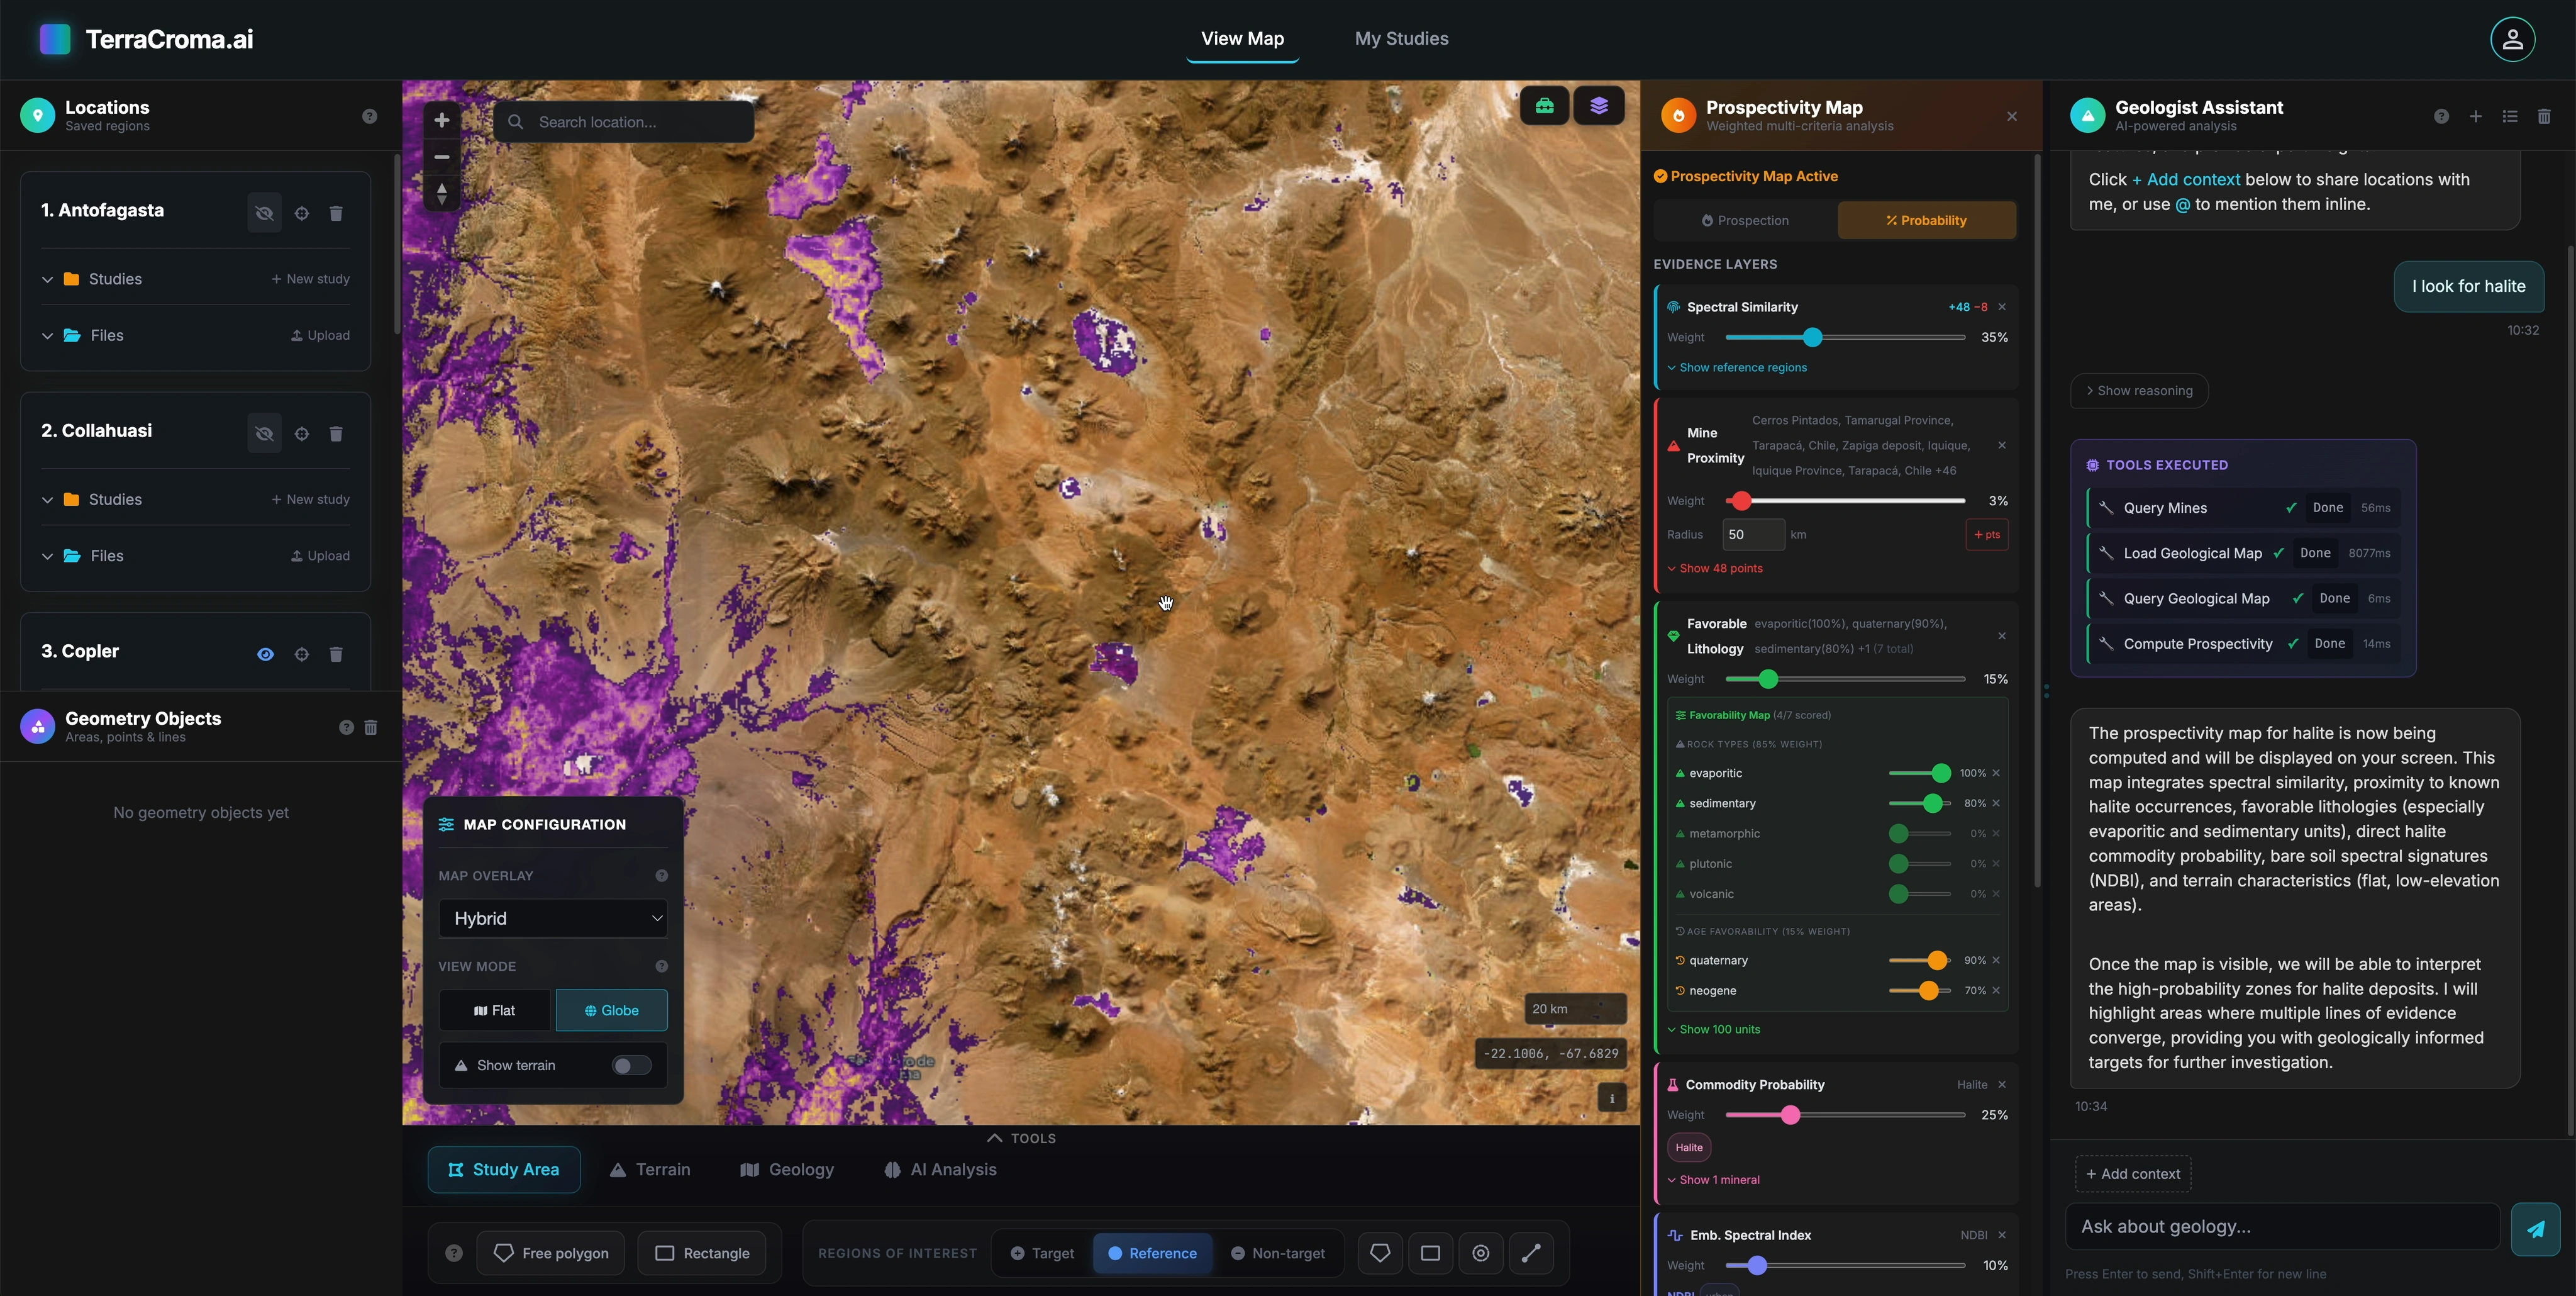
Halite prospectivity map

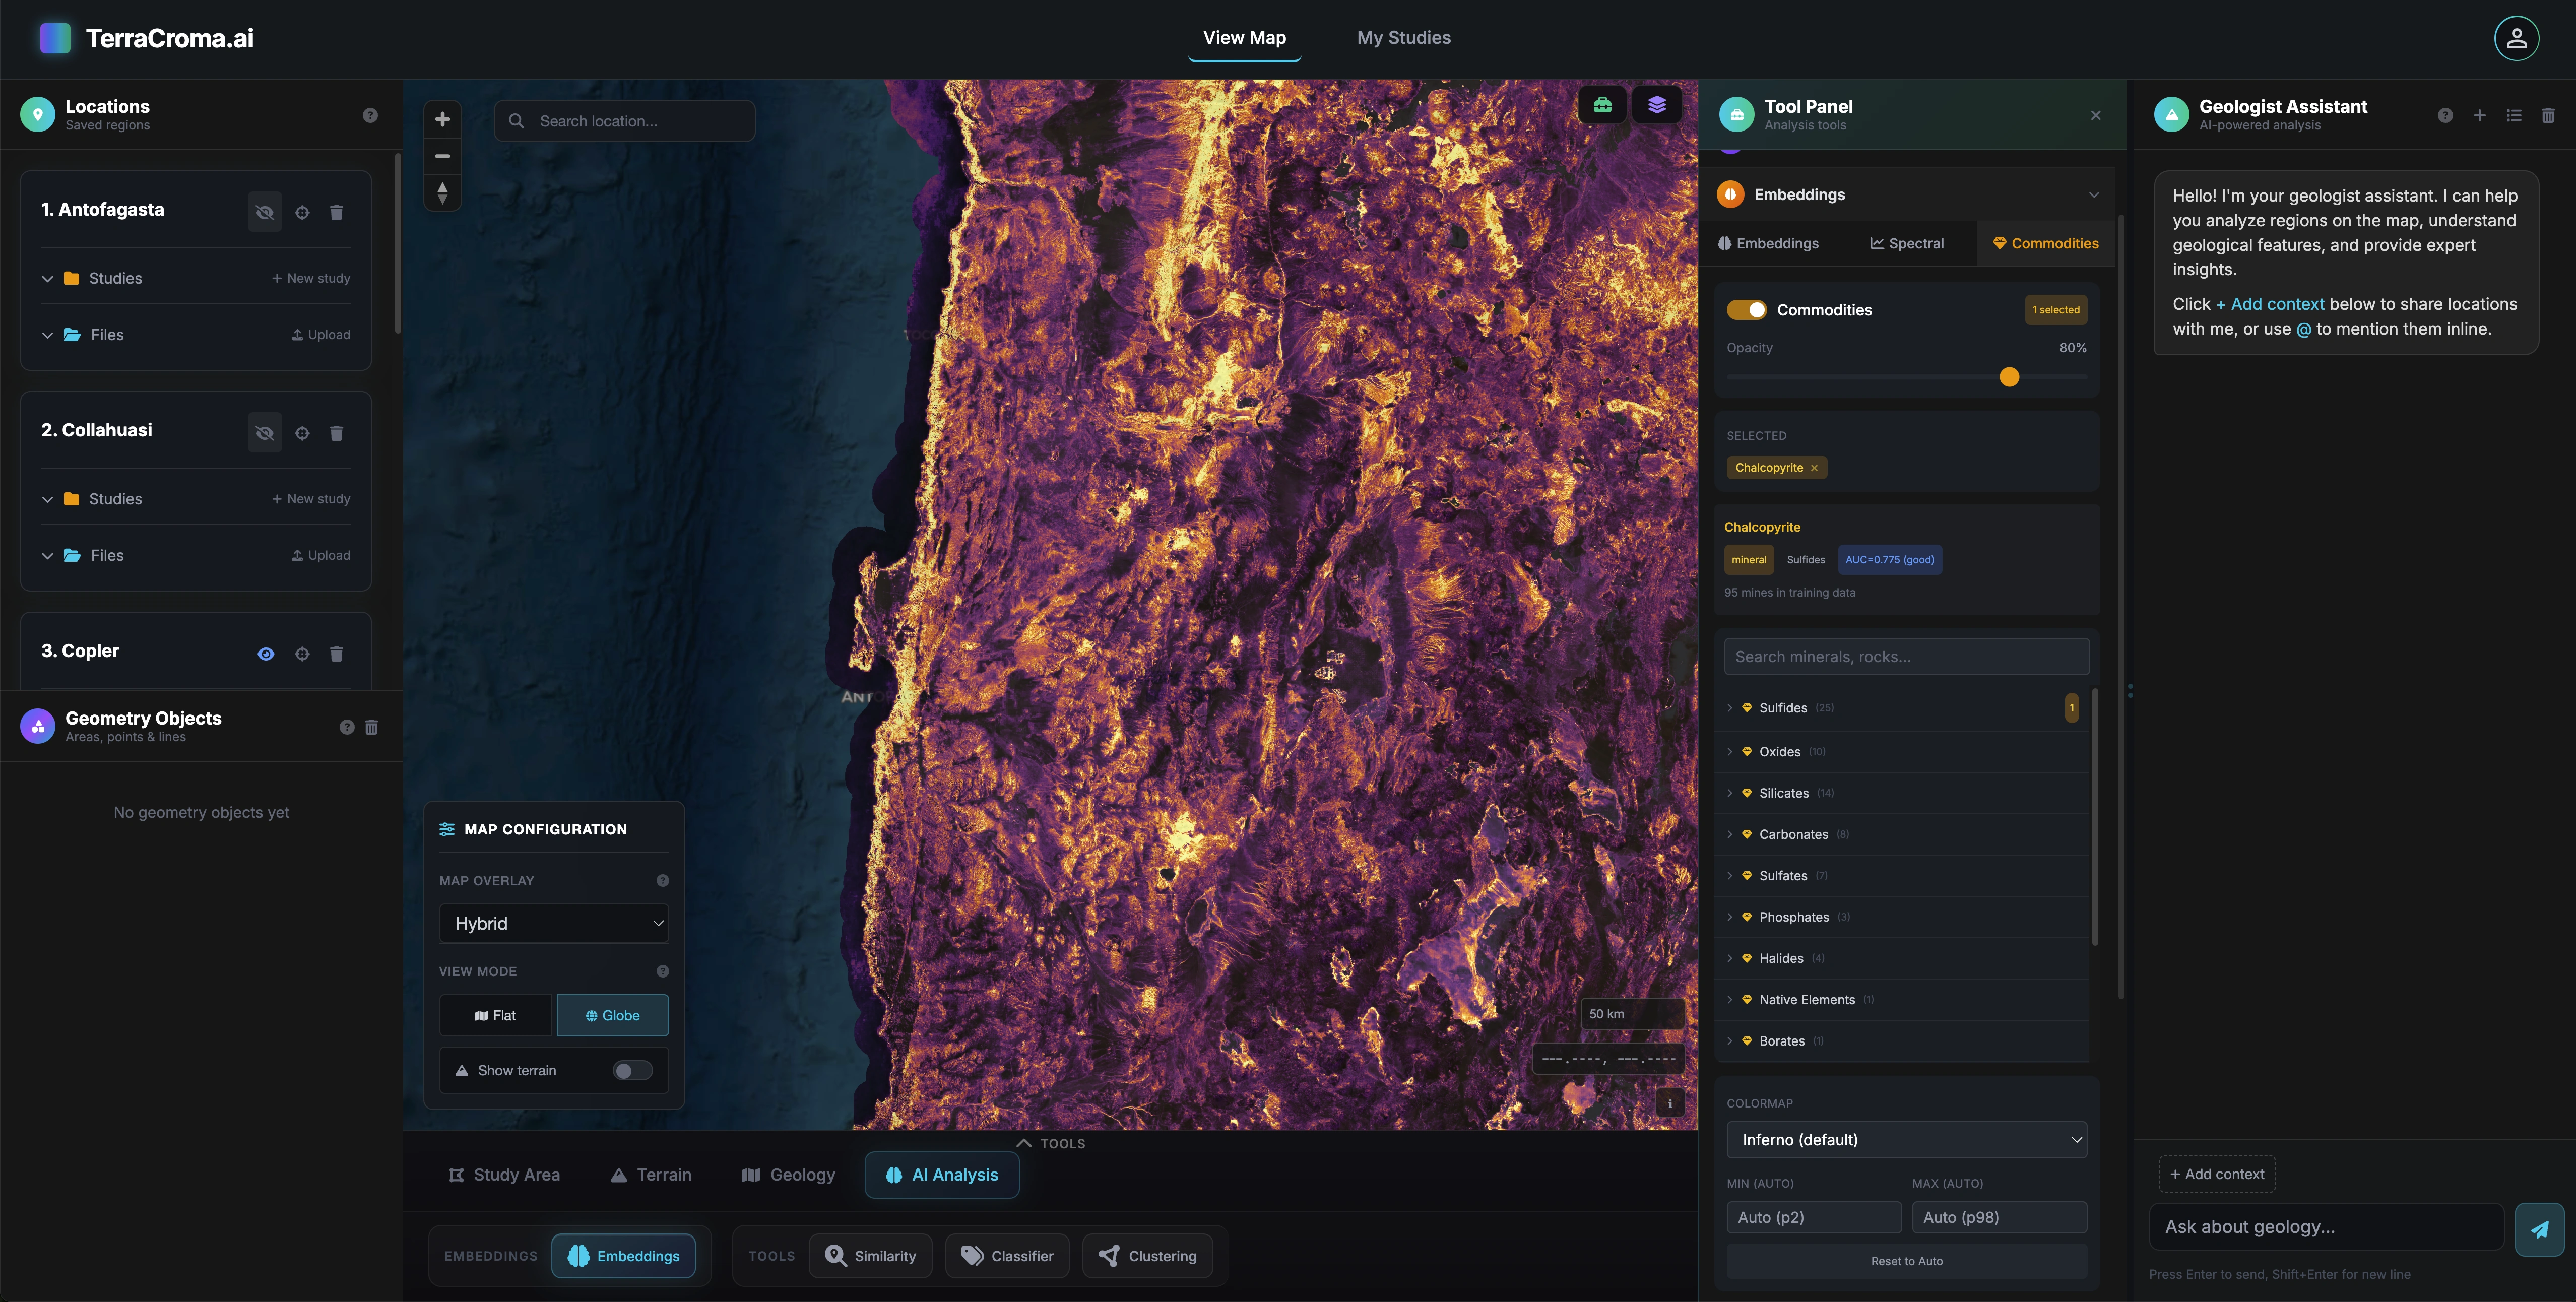
Halite prospectivity, region-scale

Bayesian fusion of spectral, geological and structural evidence into a single calibrated favorability map for the target commodity.

Spectral similarity

Mine proximity

Fault proximity

Lithology favorability

Slope & elevation

Spectral indices

Scene classification

Cluster signatures

AI spectral indices

Commodity probability

Mark positive and negative reference points. Tune the base-rate prior. Re-weight evidence on the fly. The output is a calibrated probability grid, not a black-box score.

The differentiator

The value isn't a single tool. It's the AI that merges them.

Every other platform gives you spectral indices, deposit databases, geological maps and prospectivity as separate features. Ours uses them together, in the right order, with the right parameters, from one prompt.

01 / PROMPT

"Find iron-oxide alteration within 5 km of mapped faults in this district and rank the overlap by area."

02 / AI PLAN

Decomposes the question, picks the four tools needed, orders the calls, sets parameters. No menus.

03 / CHAIN
Iron-oxide index Fault buffer Spatial intersect Rank by area

Tools run together, outputs flow into the next step.

04 / ANSWER

Annotated map with three ranked target zones, citations to the data layers used, ready to refine.

03.2Imagery & Super-resolution

AI-driven super-resolution.

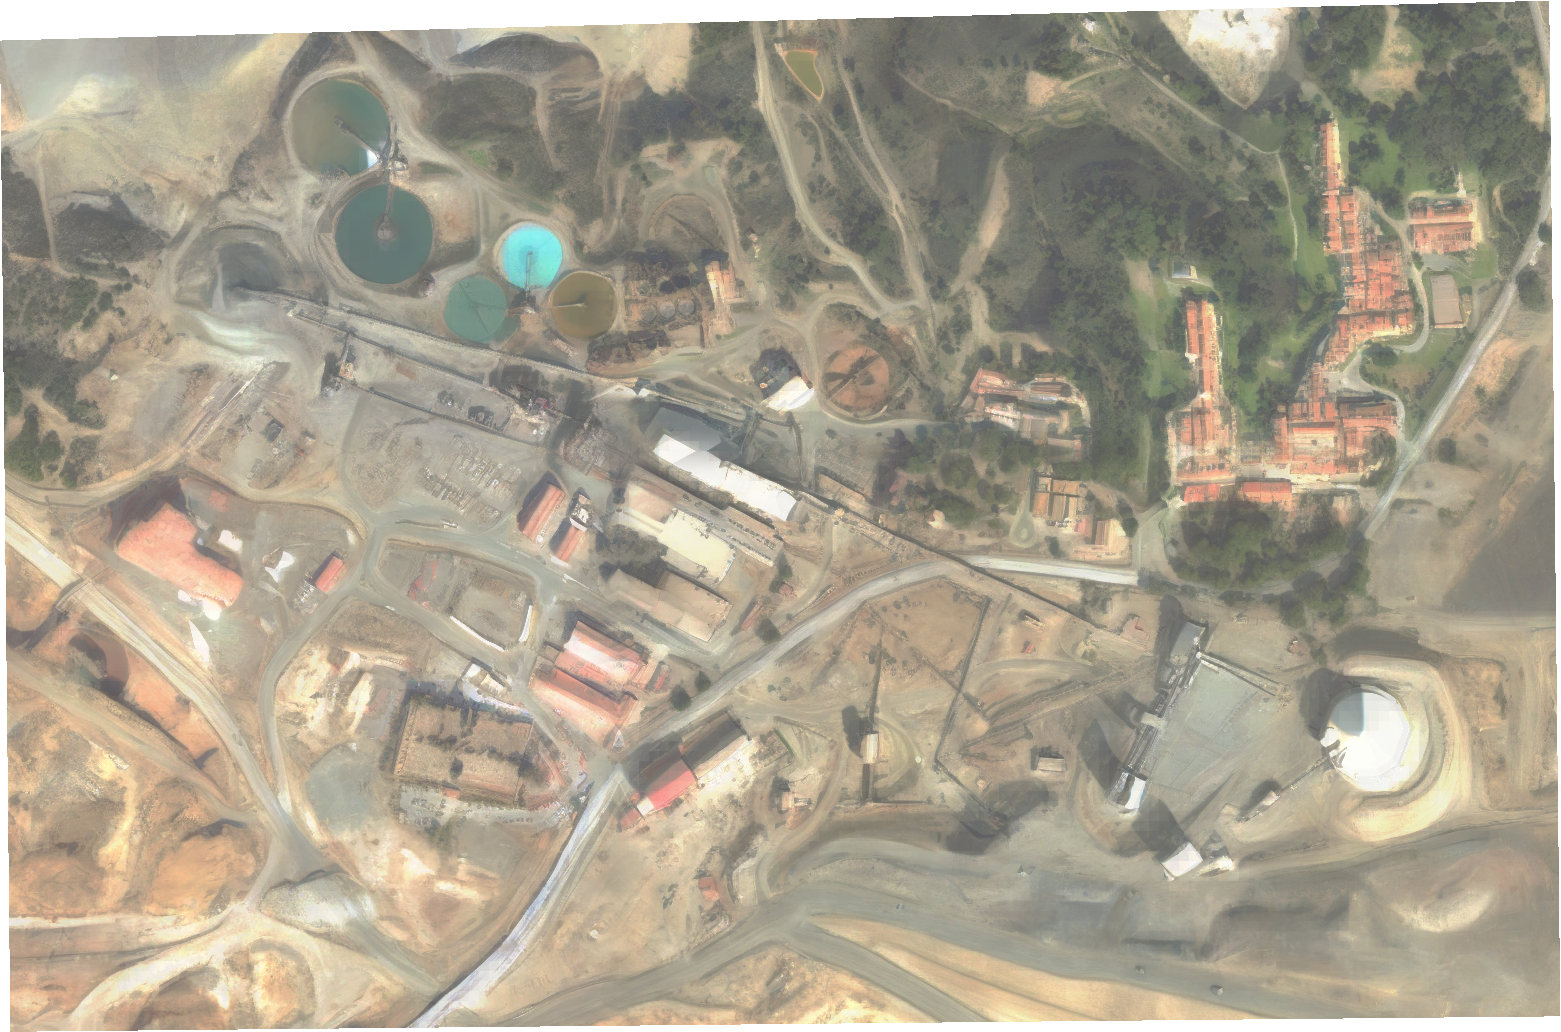
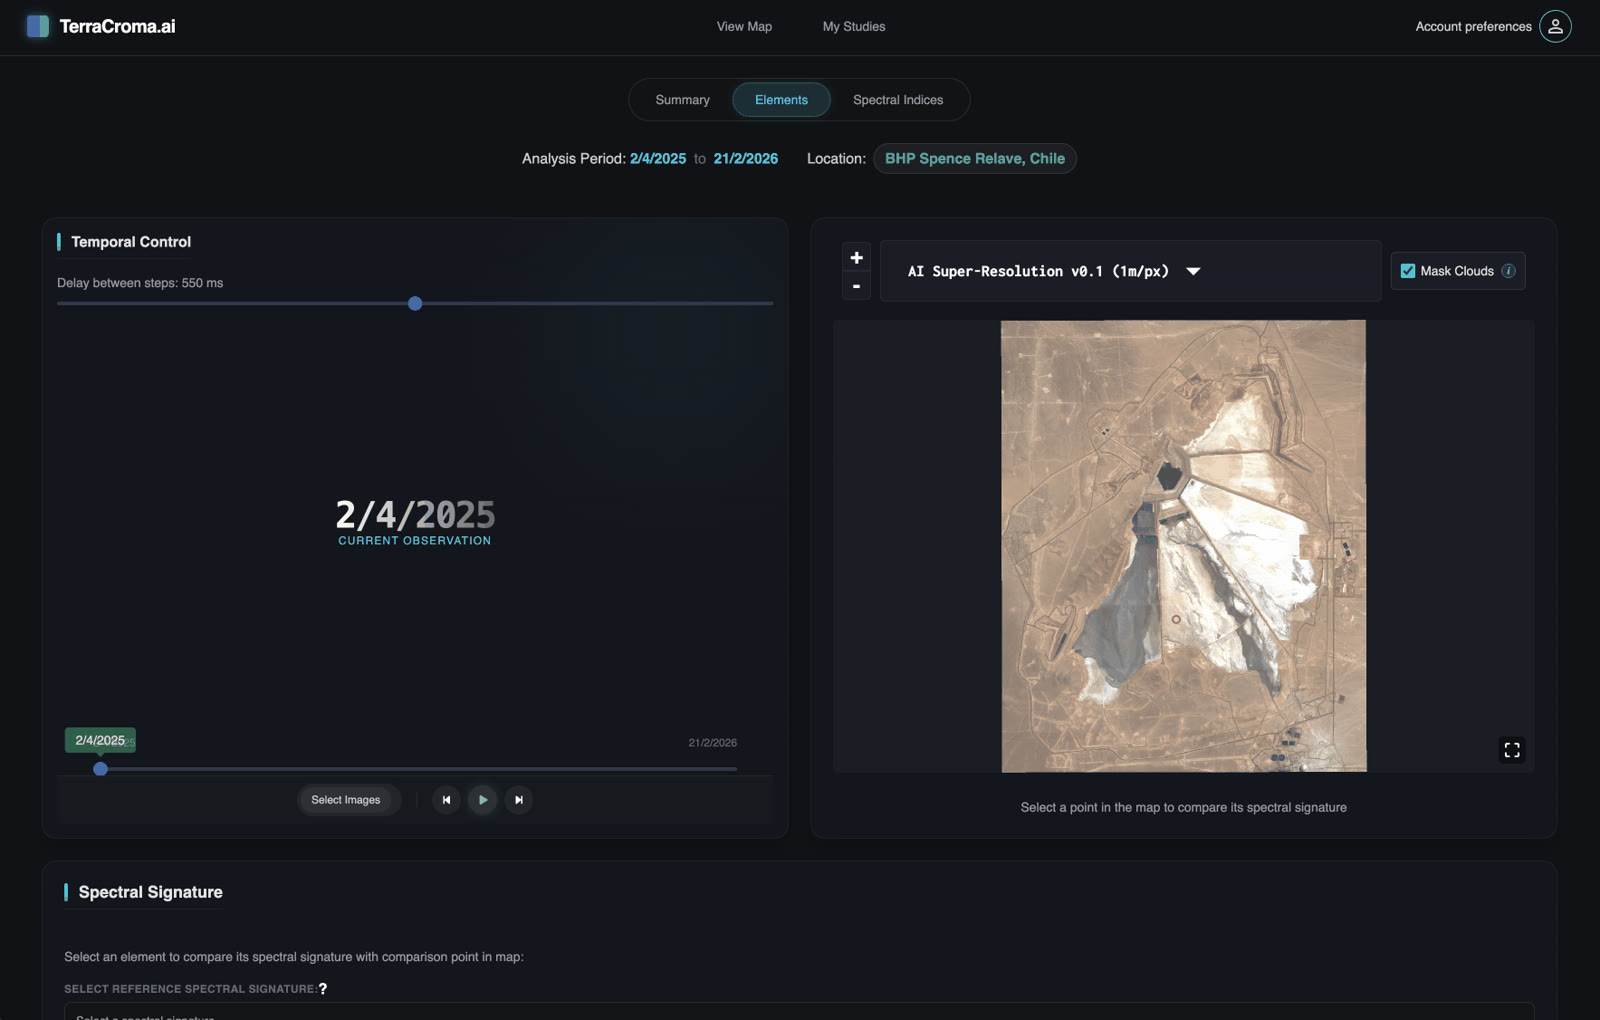
Search Copernicus by polygon, date and cloud cover. Pull only the dates that matter. Then run AI super-resolution from native 10 m down to 1 m to recover detail that pixels alone can't show.

Native Sentinel-2 (10 m) AI super-resolution (up to 1 m)
Drag the handle to compare
Native 10 m AI super-res · 1 m

Smart search

Filter by polygon coverage, cloud %, date range. Pick only what you need.

10 m → 1 m

Asynchronous super-resolution with progress tracking and retry.

GeoTIFF export

Georeferenced outputs ready for QGIS, ArcGIS or your processing pipeline.

03.3Spectral Similarity & Classification

"Find me everywhere that looks like this."

Point at one outcrop and get every spectrally-similar pixel on Earth back in seconds. Group them automatically, train your own classifier on samples you draw, project any spectral index at planetary scale, without downloading a single scene.

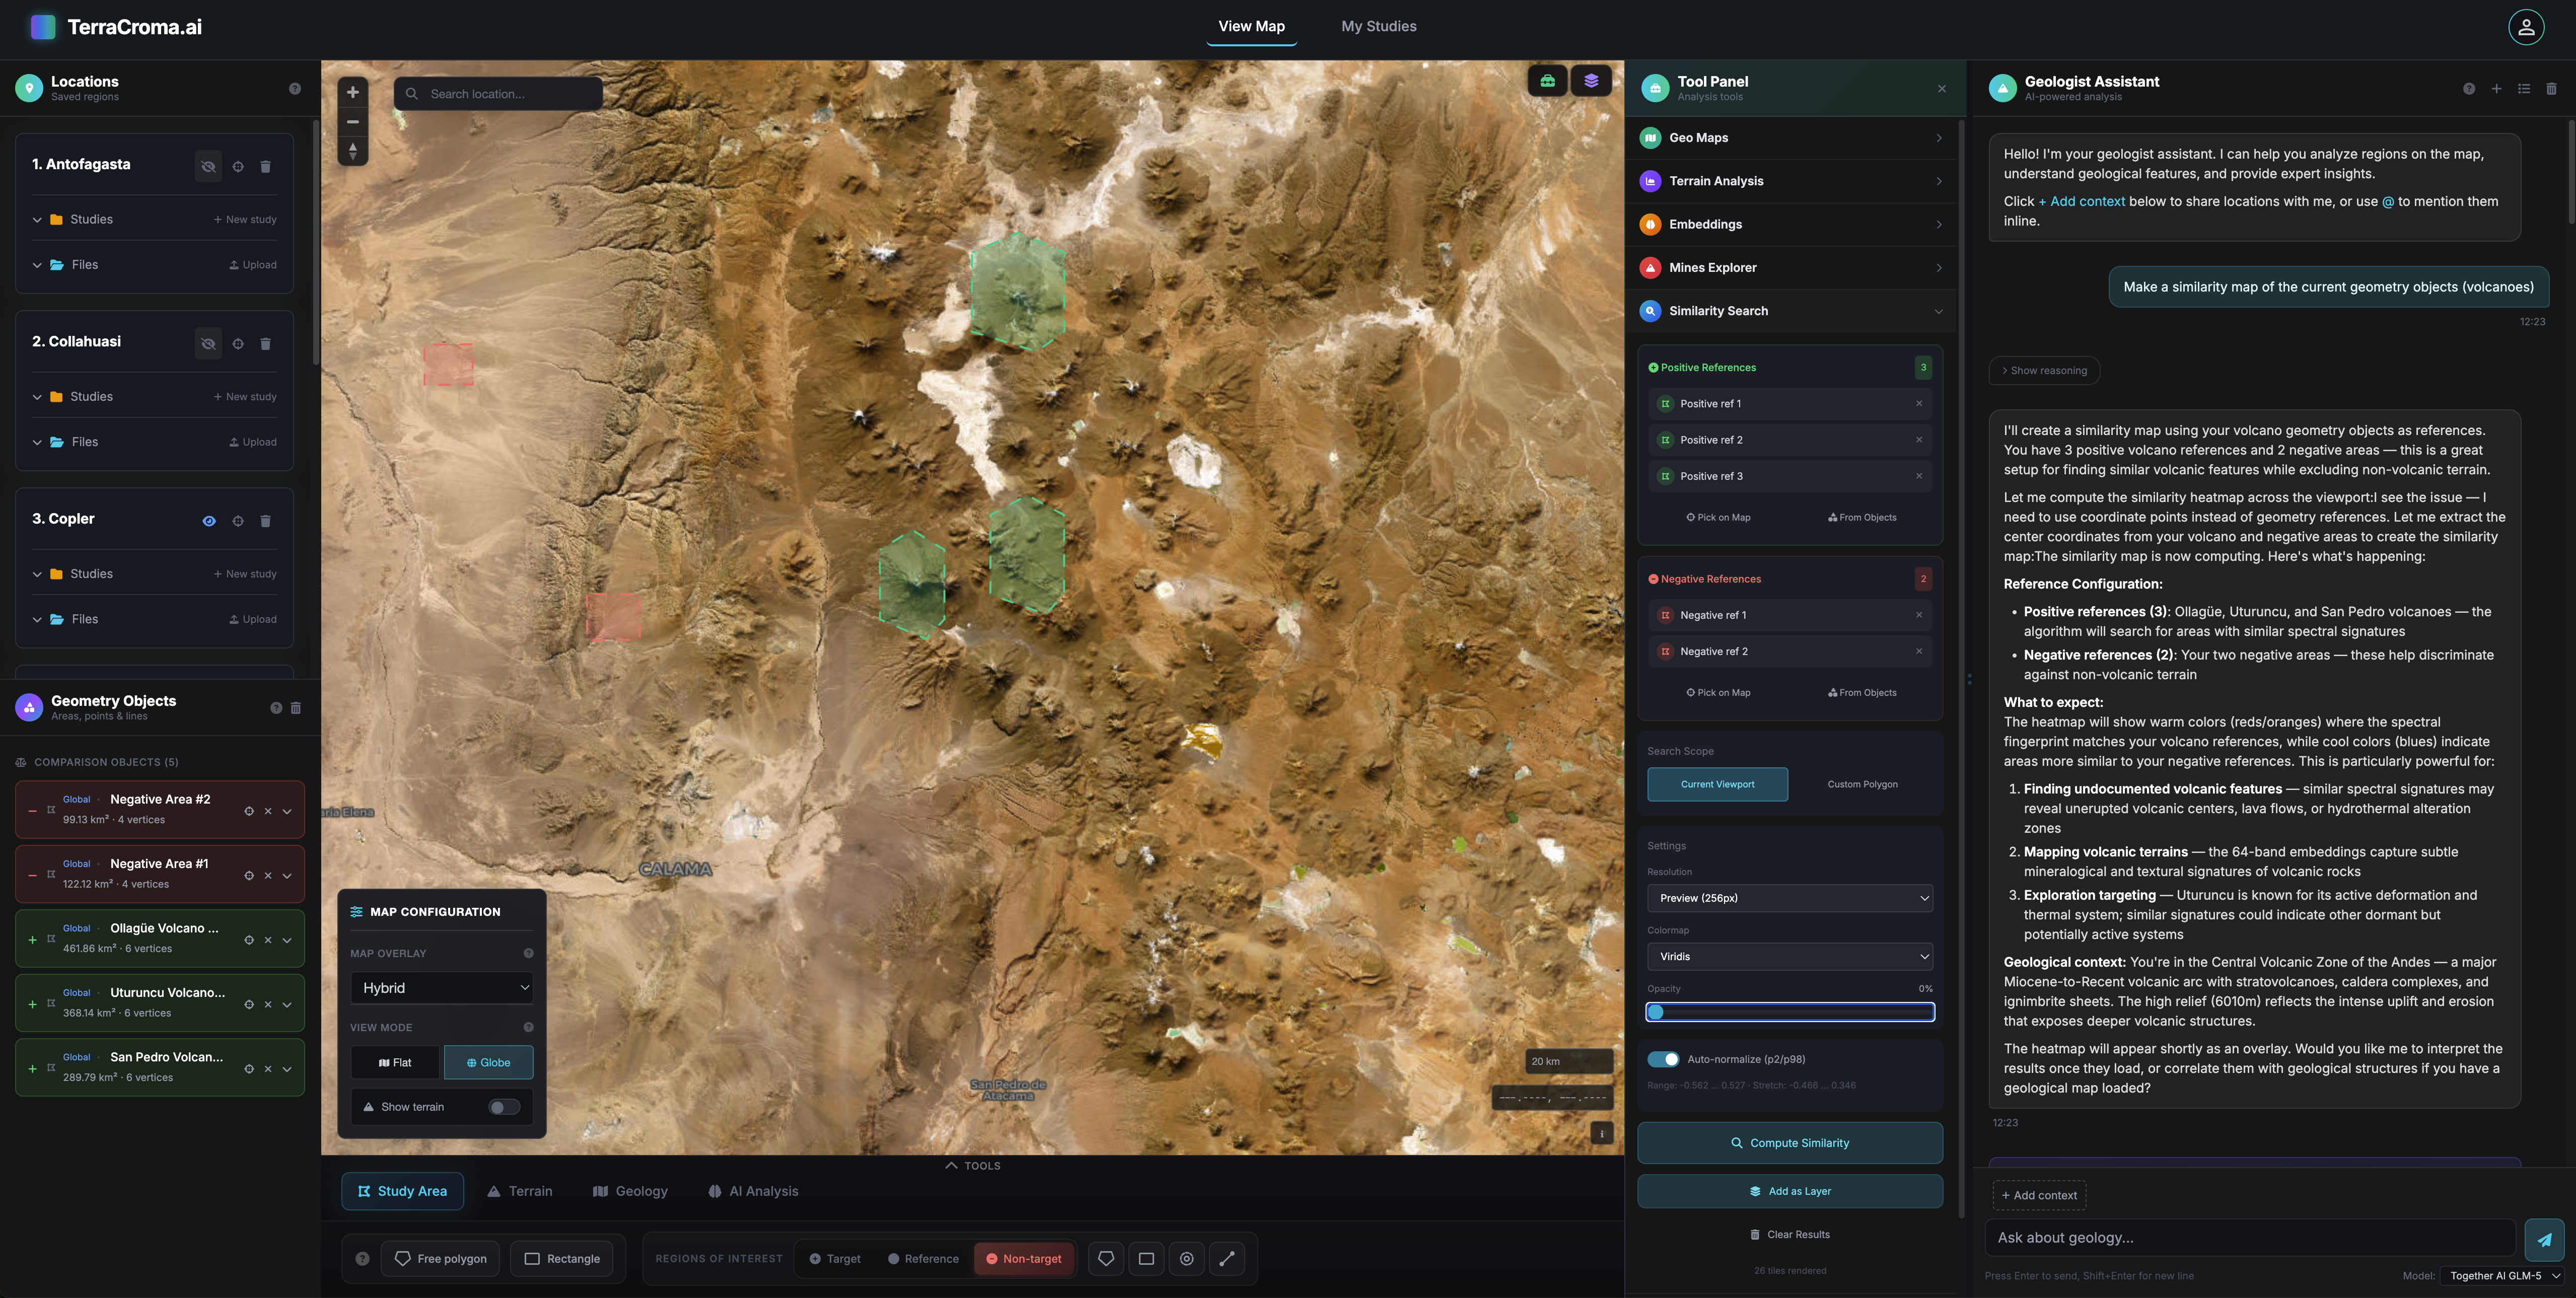
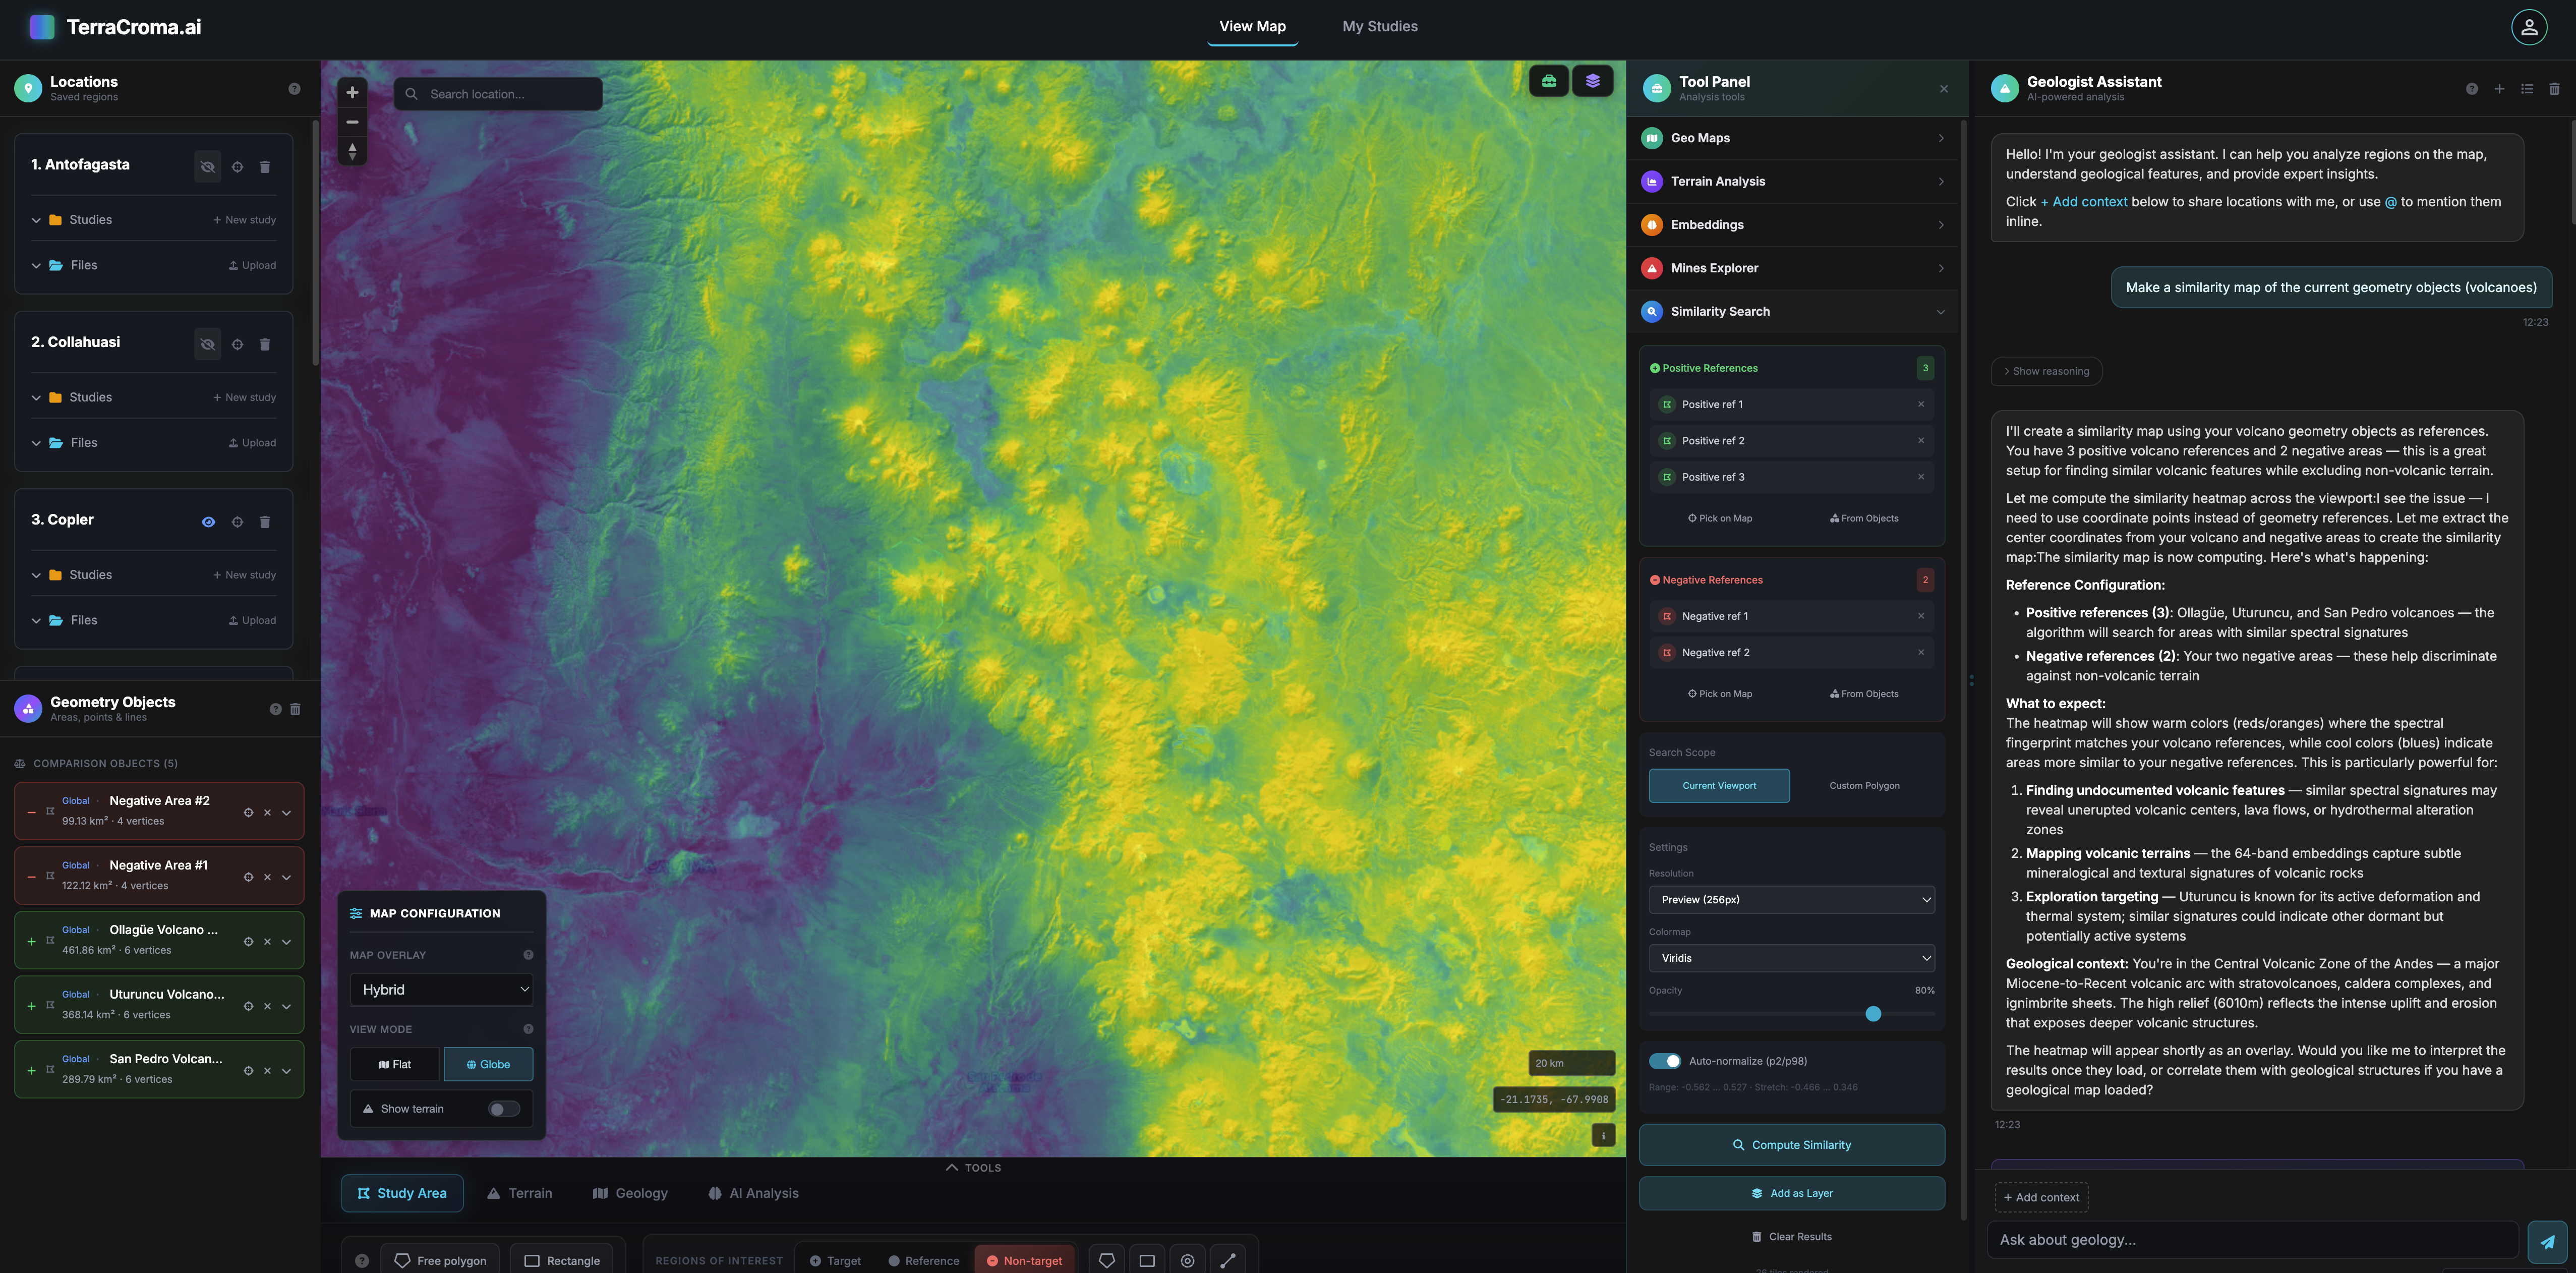
Selecting positive and negative reference regions

Pick reference regions

The assistant selects regions of interest as positive and negative references.

Spectral similarity ranked against the references

Spectral similarity search

The assistant runs similarity to find regions similar to the positive references and different from the negative ones.

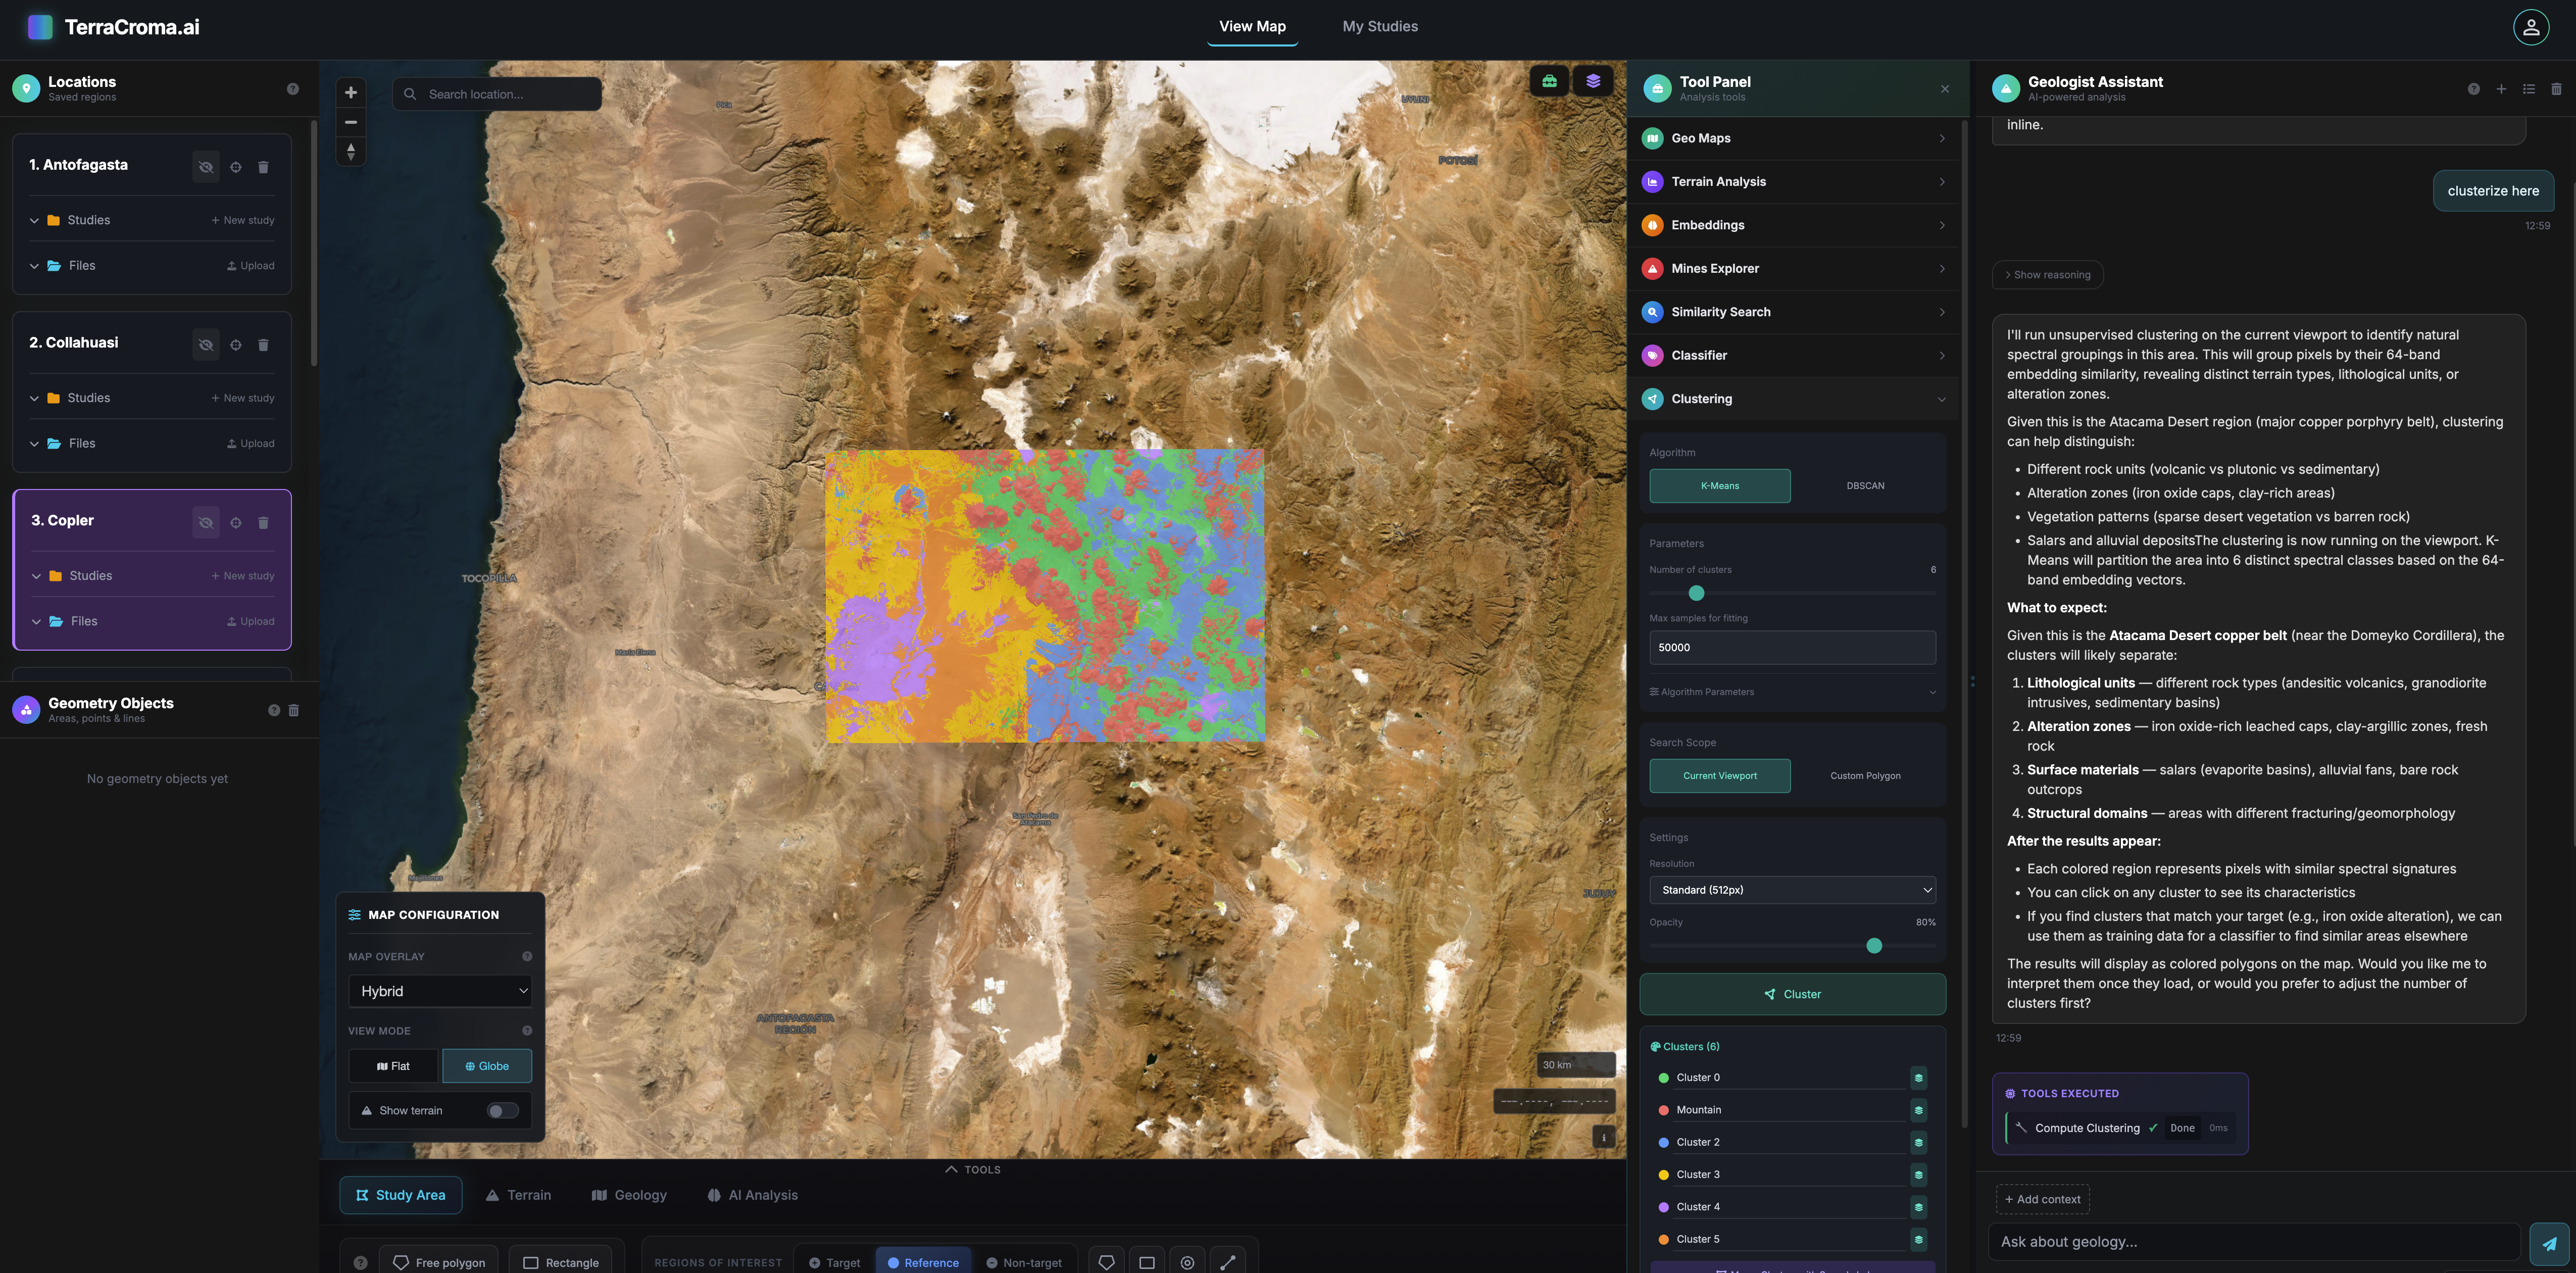
Unsupervised clustering of the scene

Unsupervised clustering

The assistant runs clustering classification on the scene.

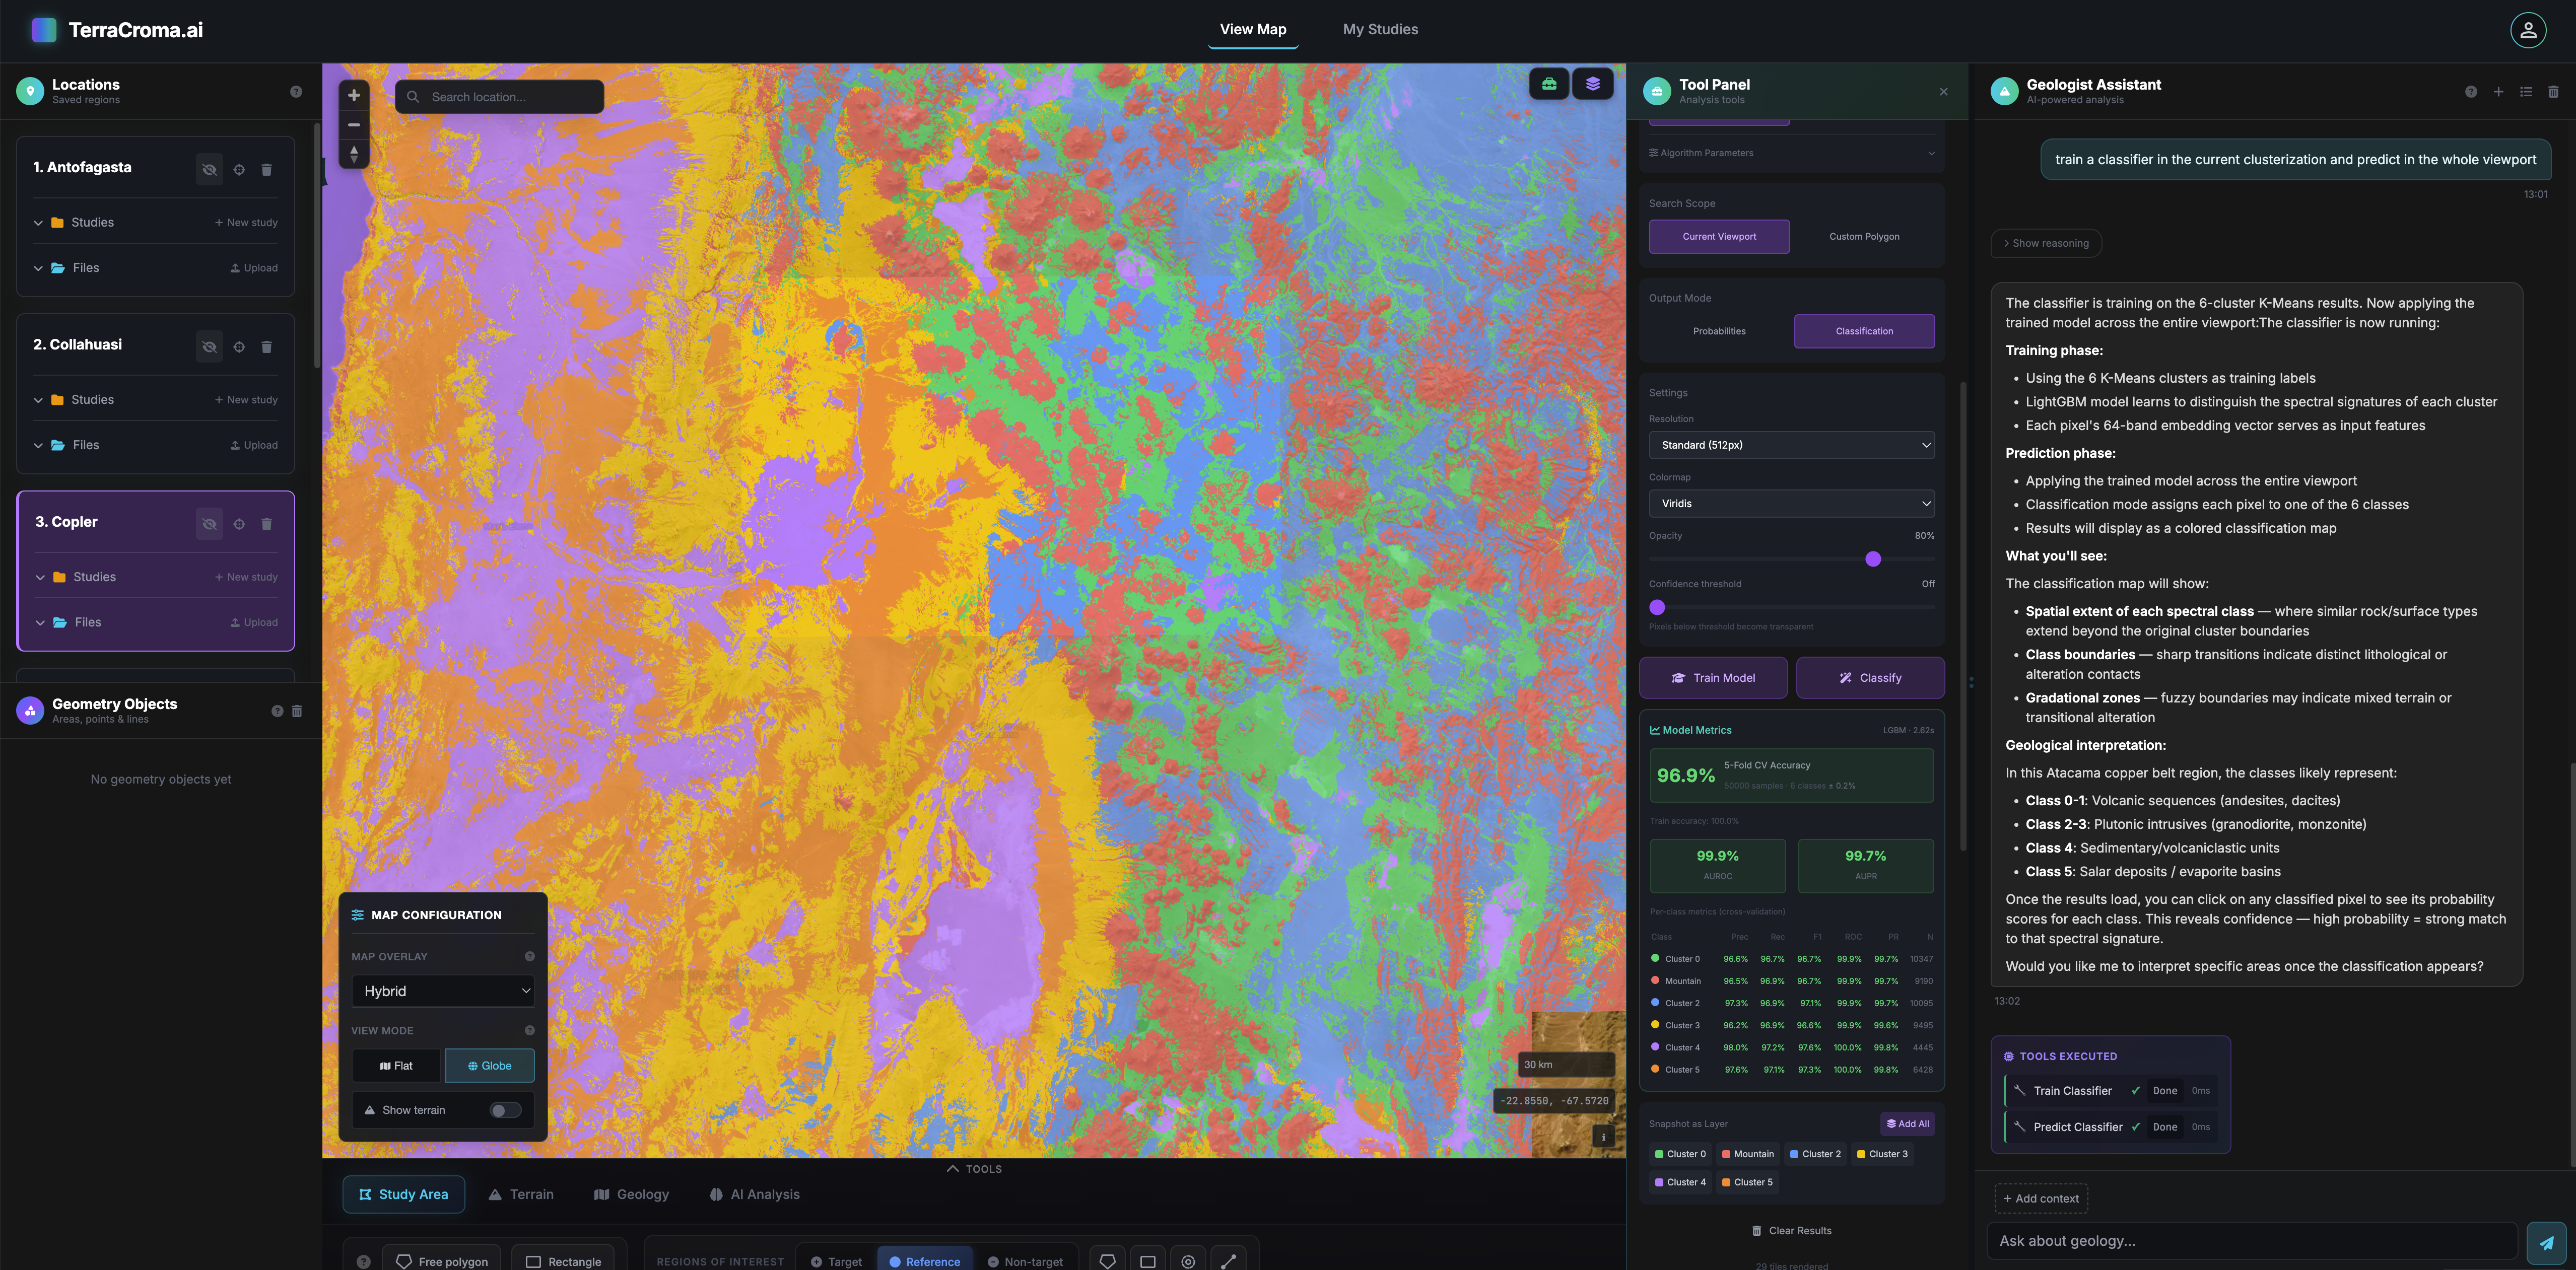
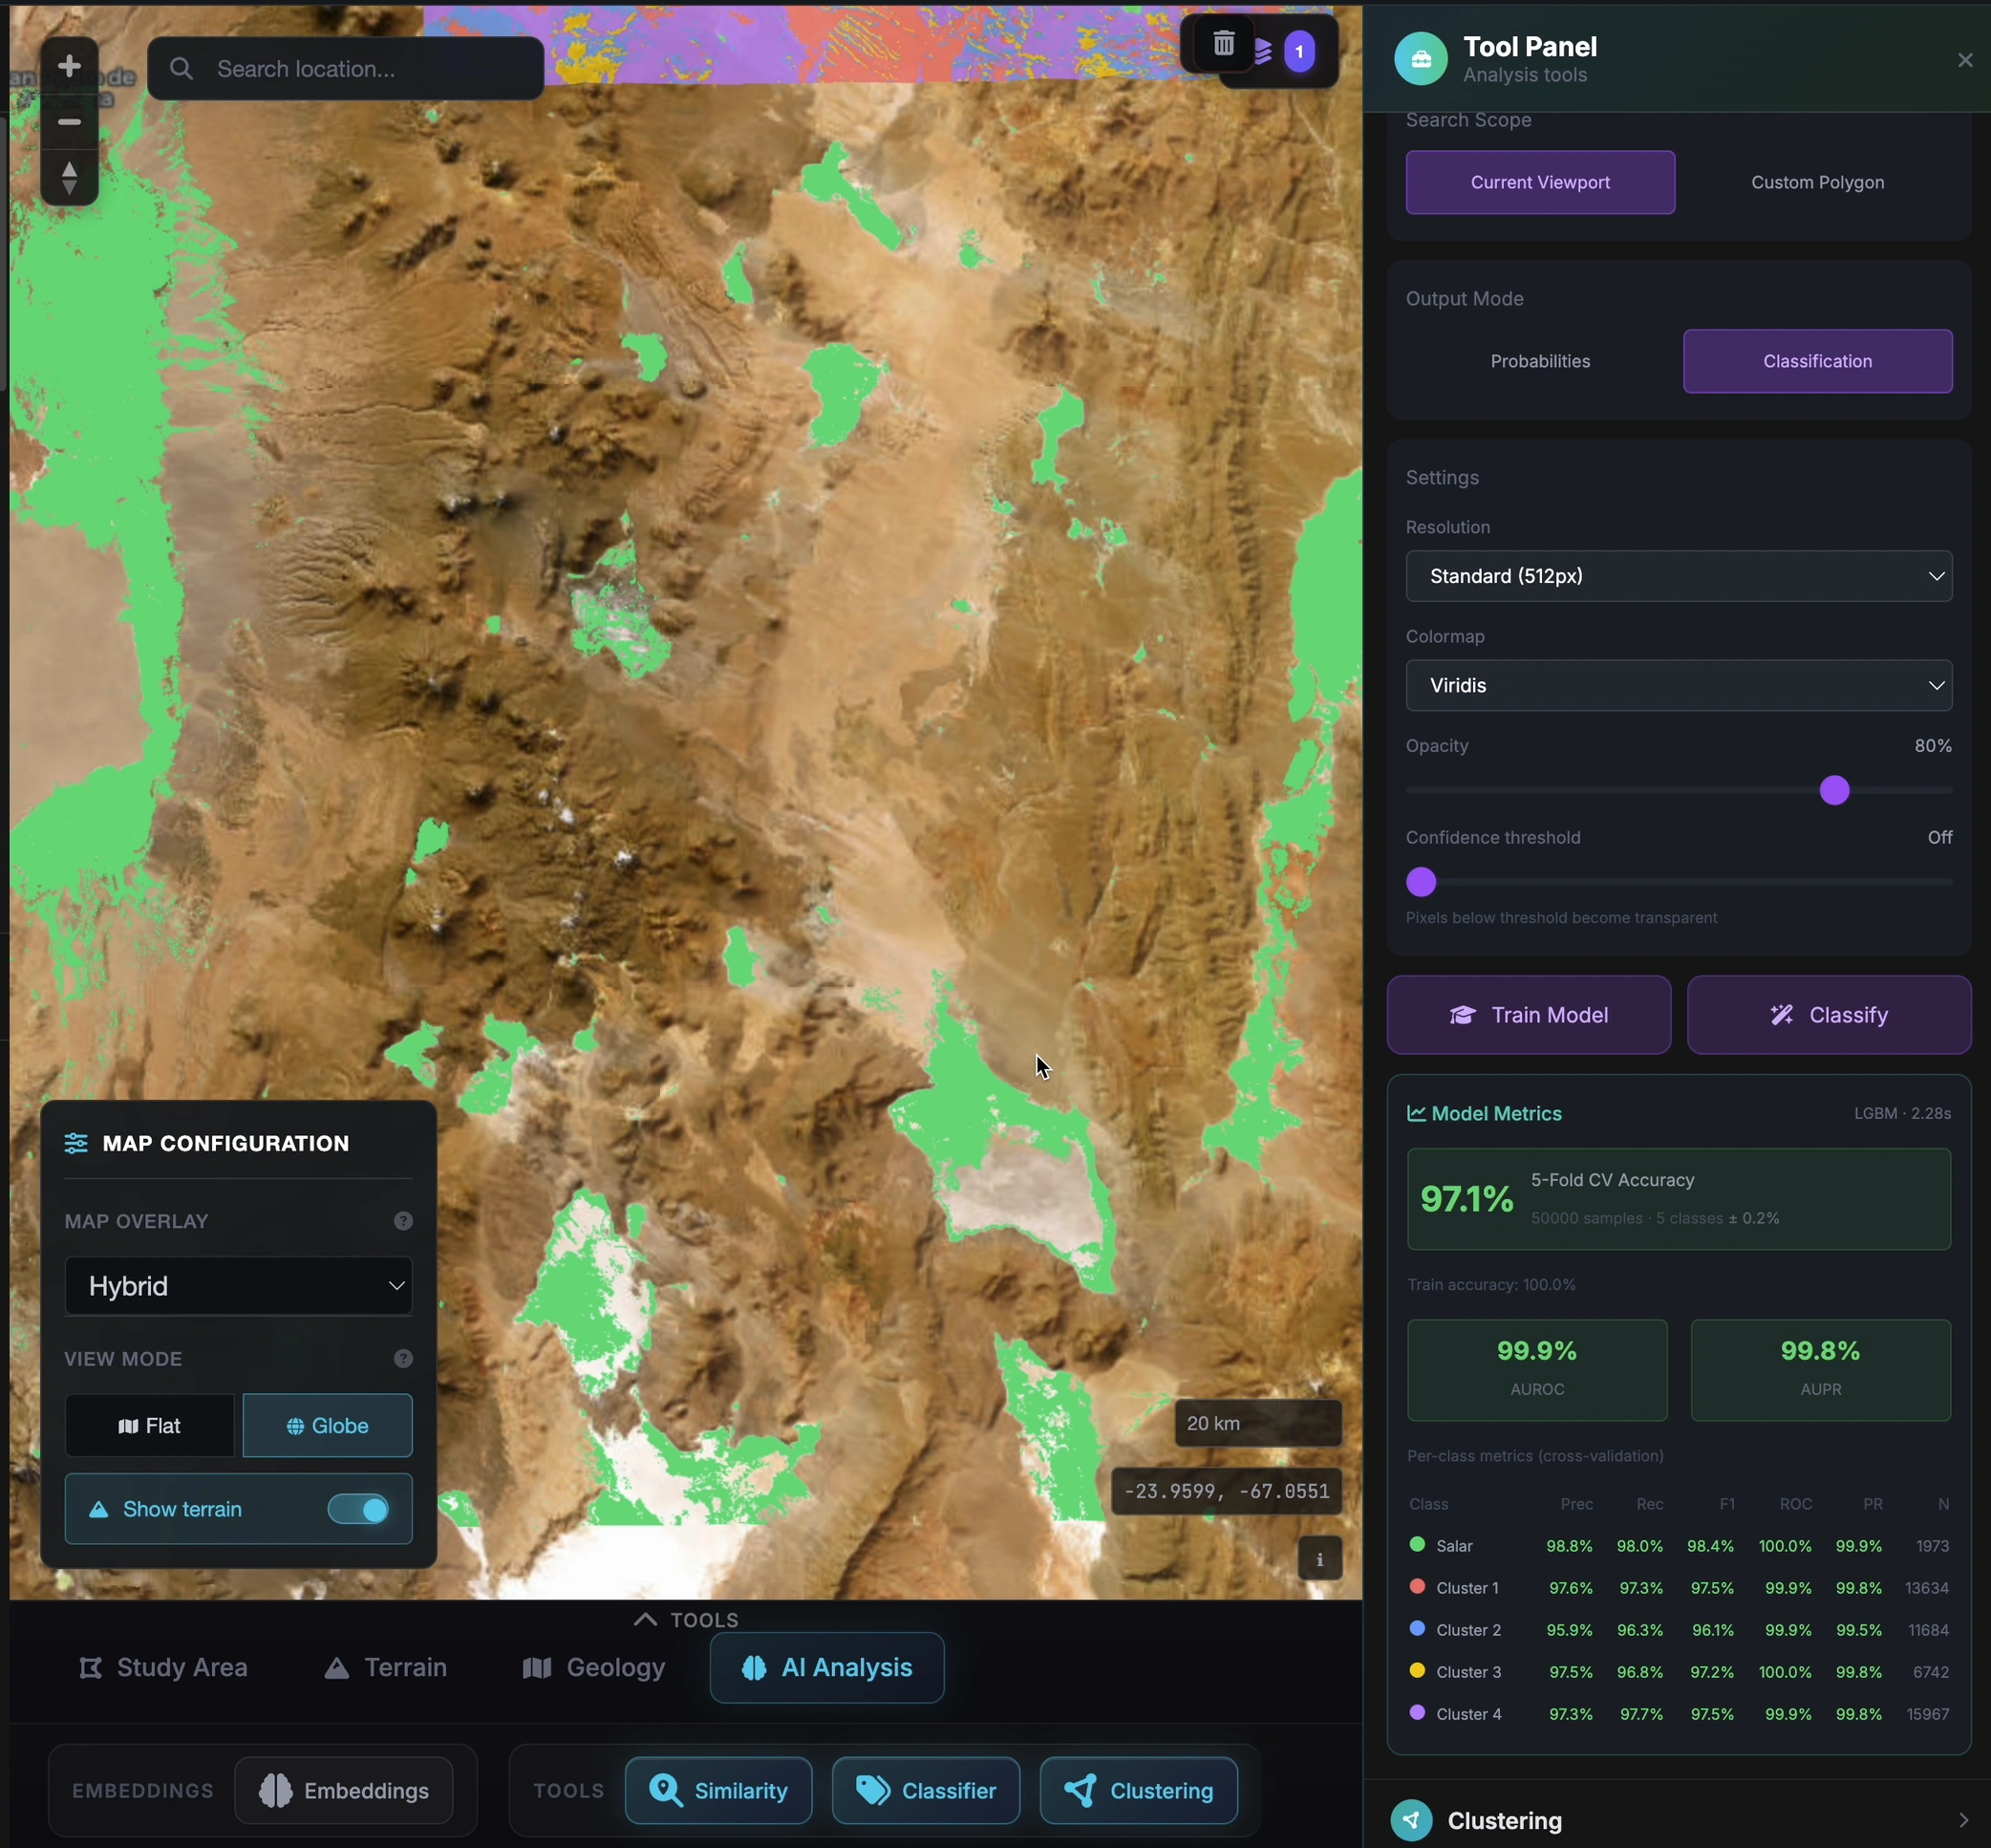
Trained ML model classifying the region

Custom ML classifier

The assistant trains an ML model and classifies the region.

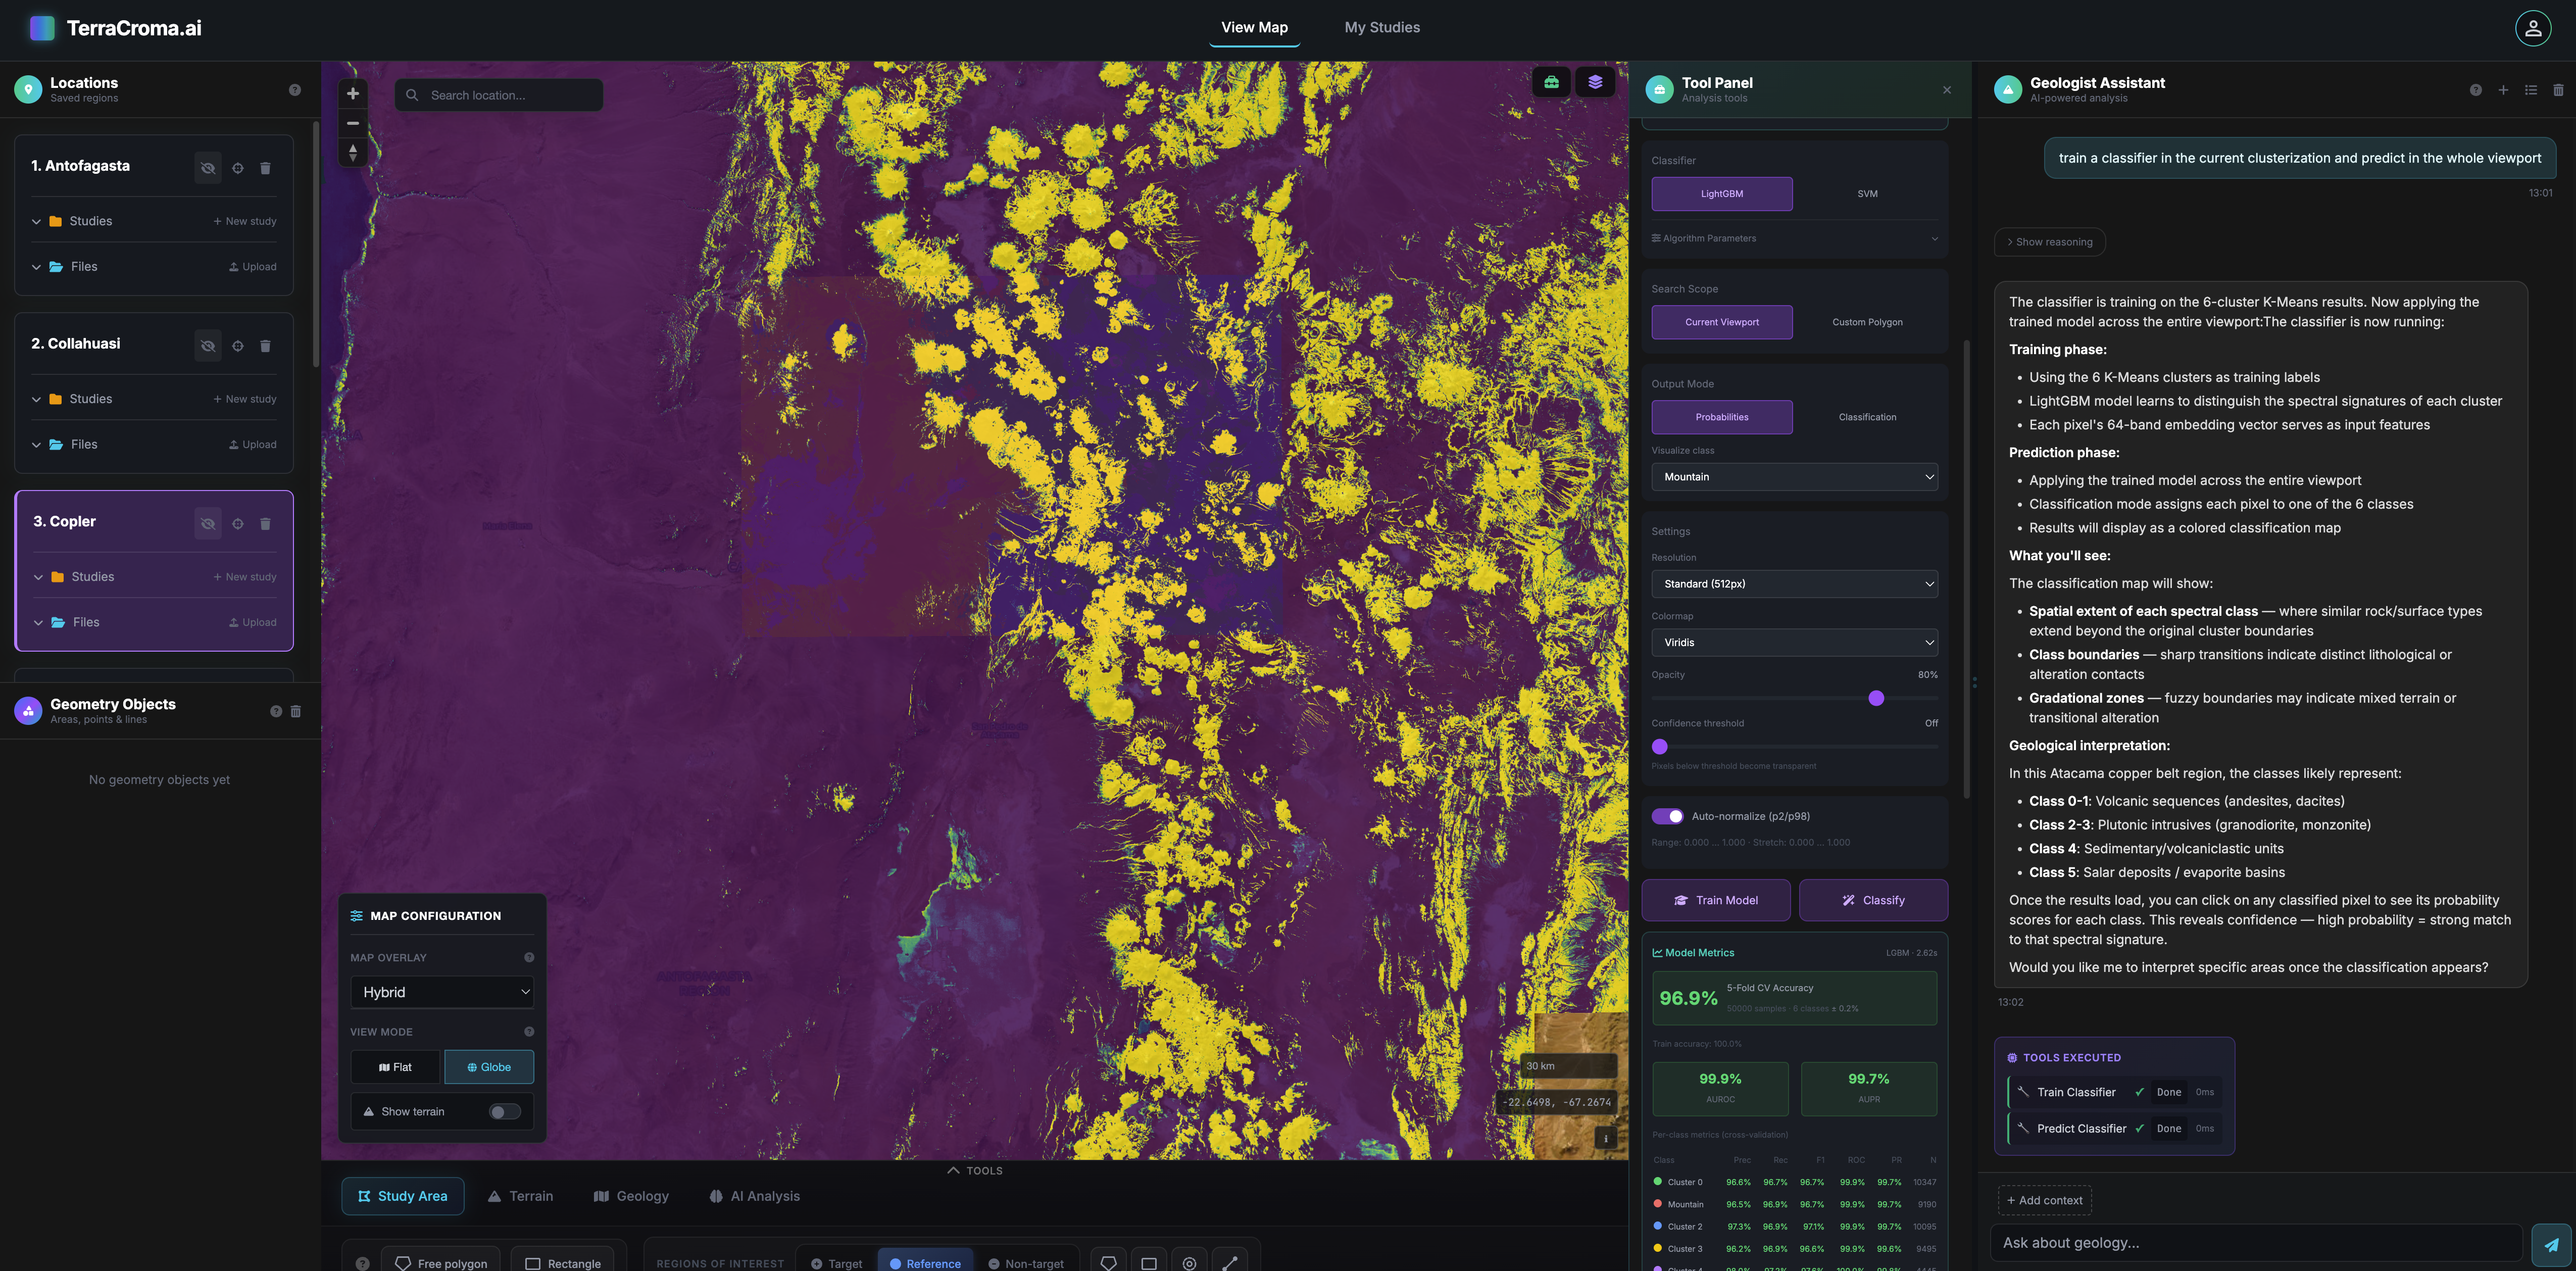
Per-class confidence map from the trained model

Per-class confidence map

The same trained model shows a confidence map for the classes.

Chalcopyrite similarity

Find every chalcopyrite signature

Click a reference outcrop. Similar spectral signatures highlight at planetary scale.

Halite similarity

Different mineral, same workflow

Halite-like signatures across the planet from a single reference pixel.

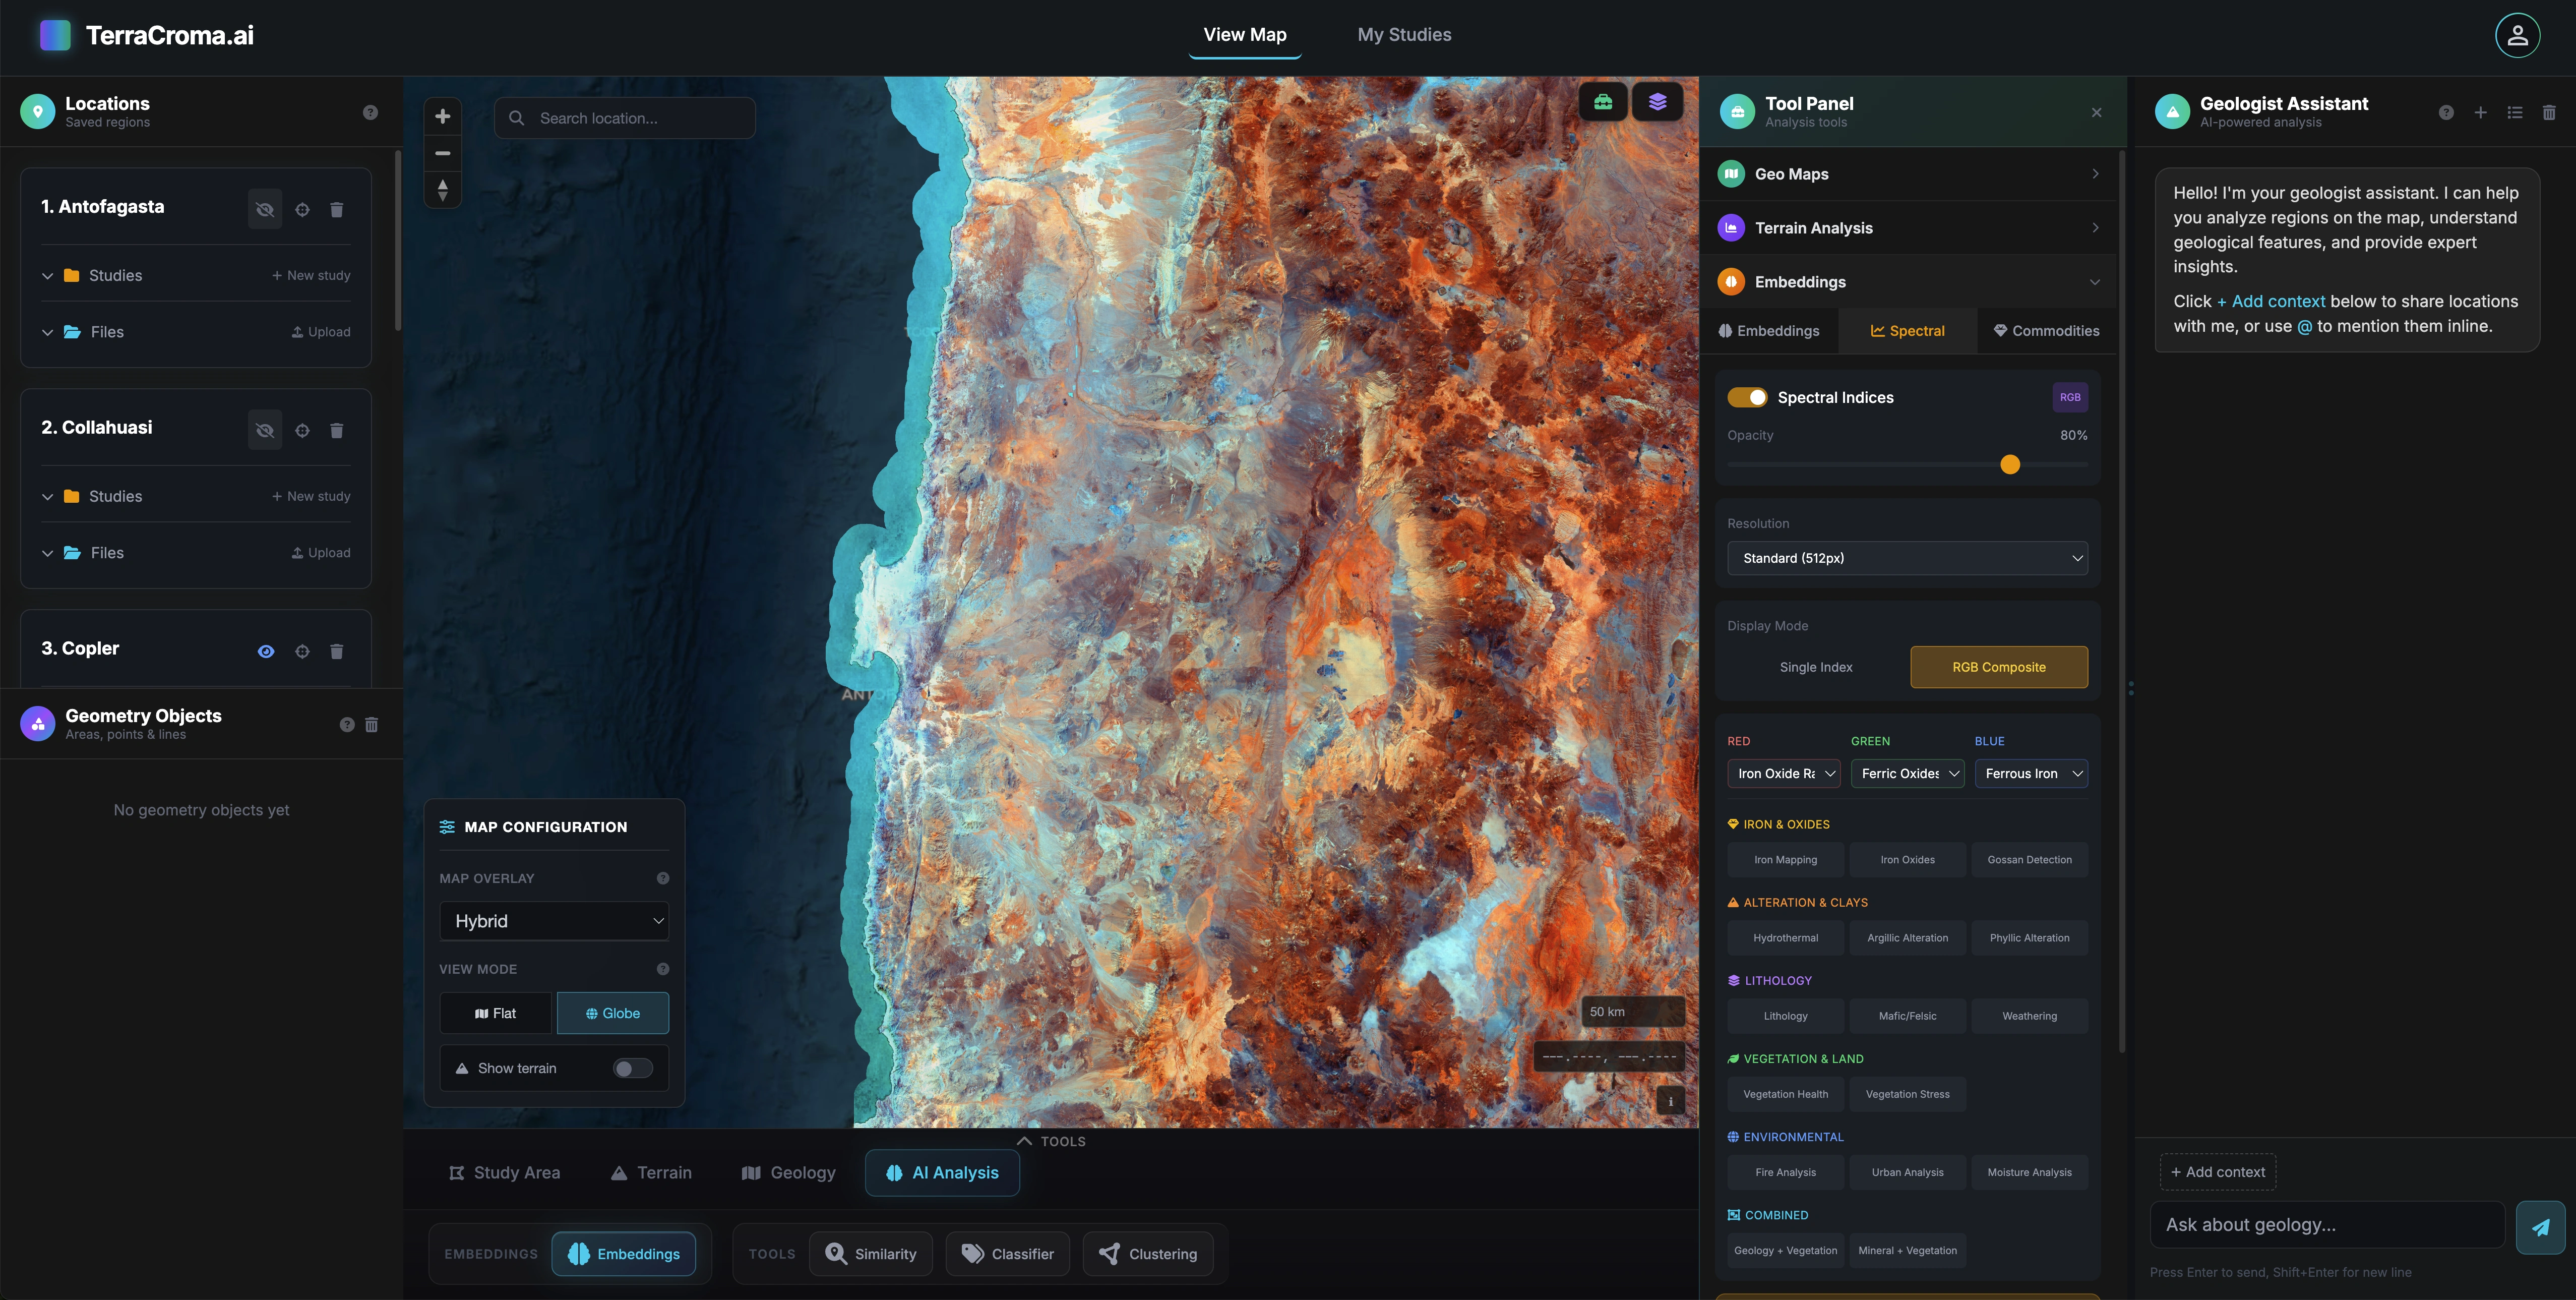
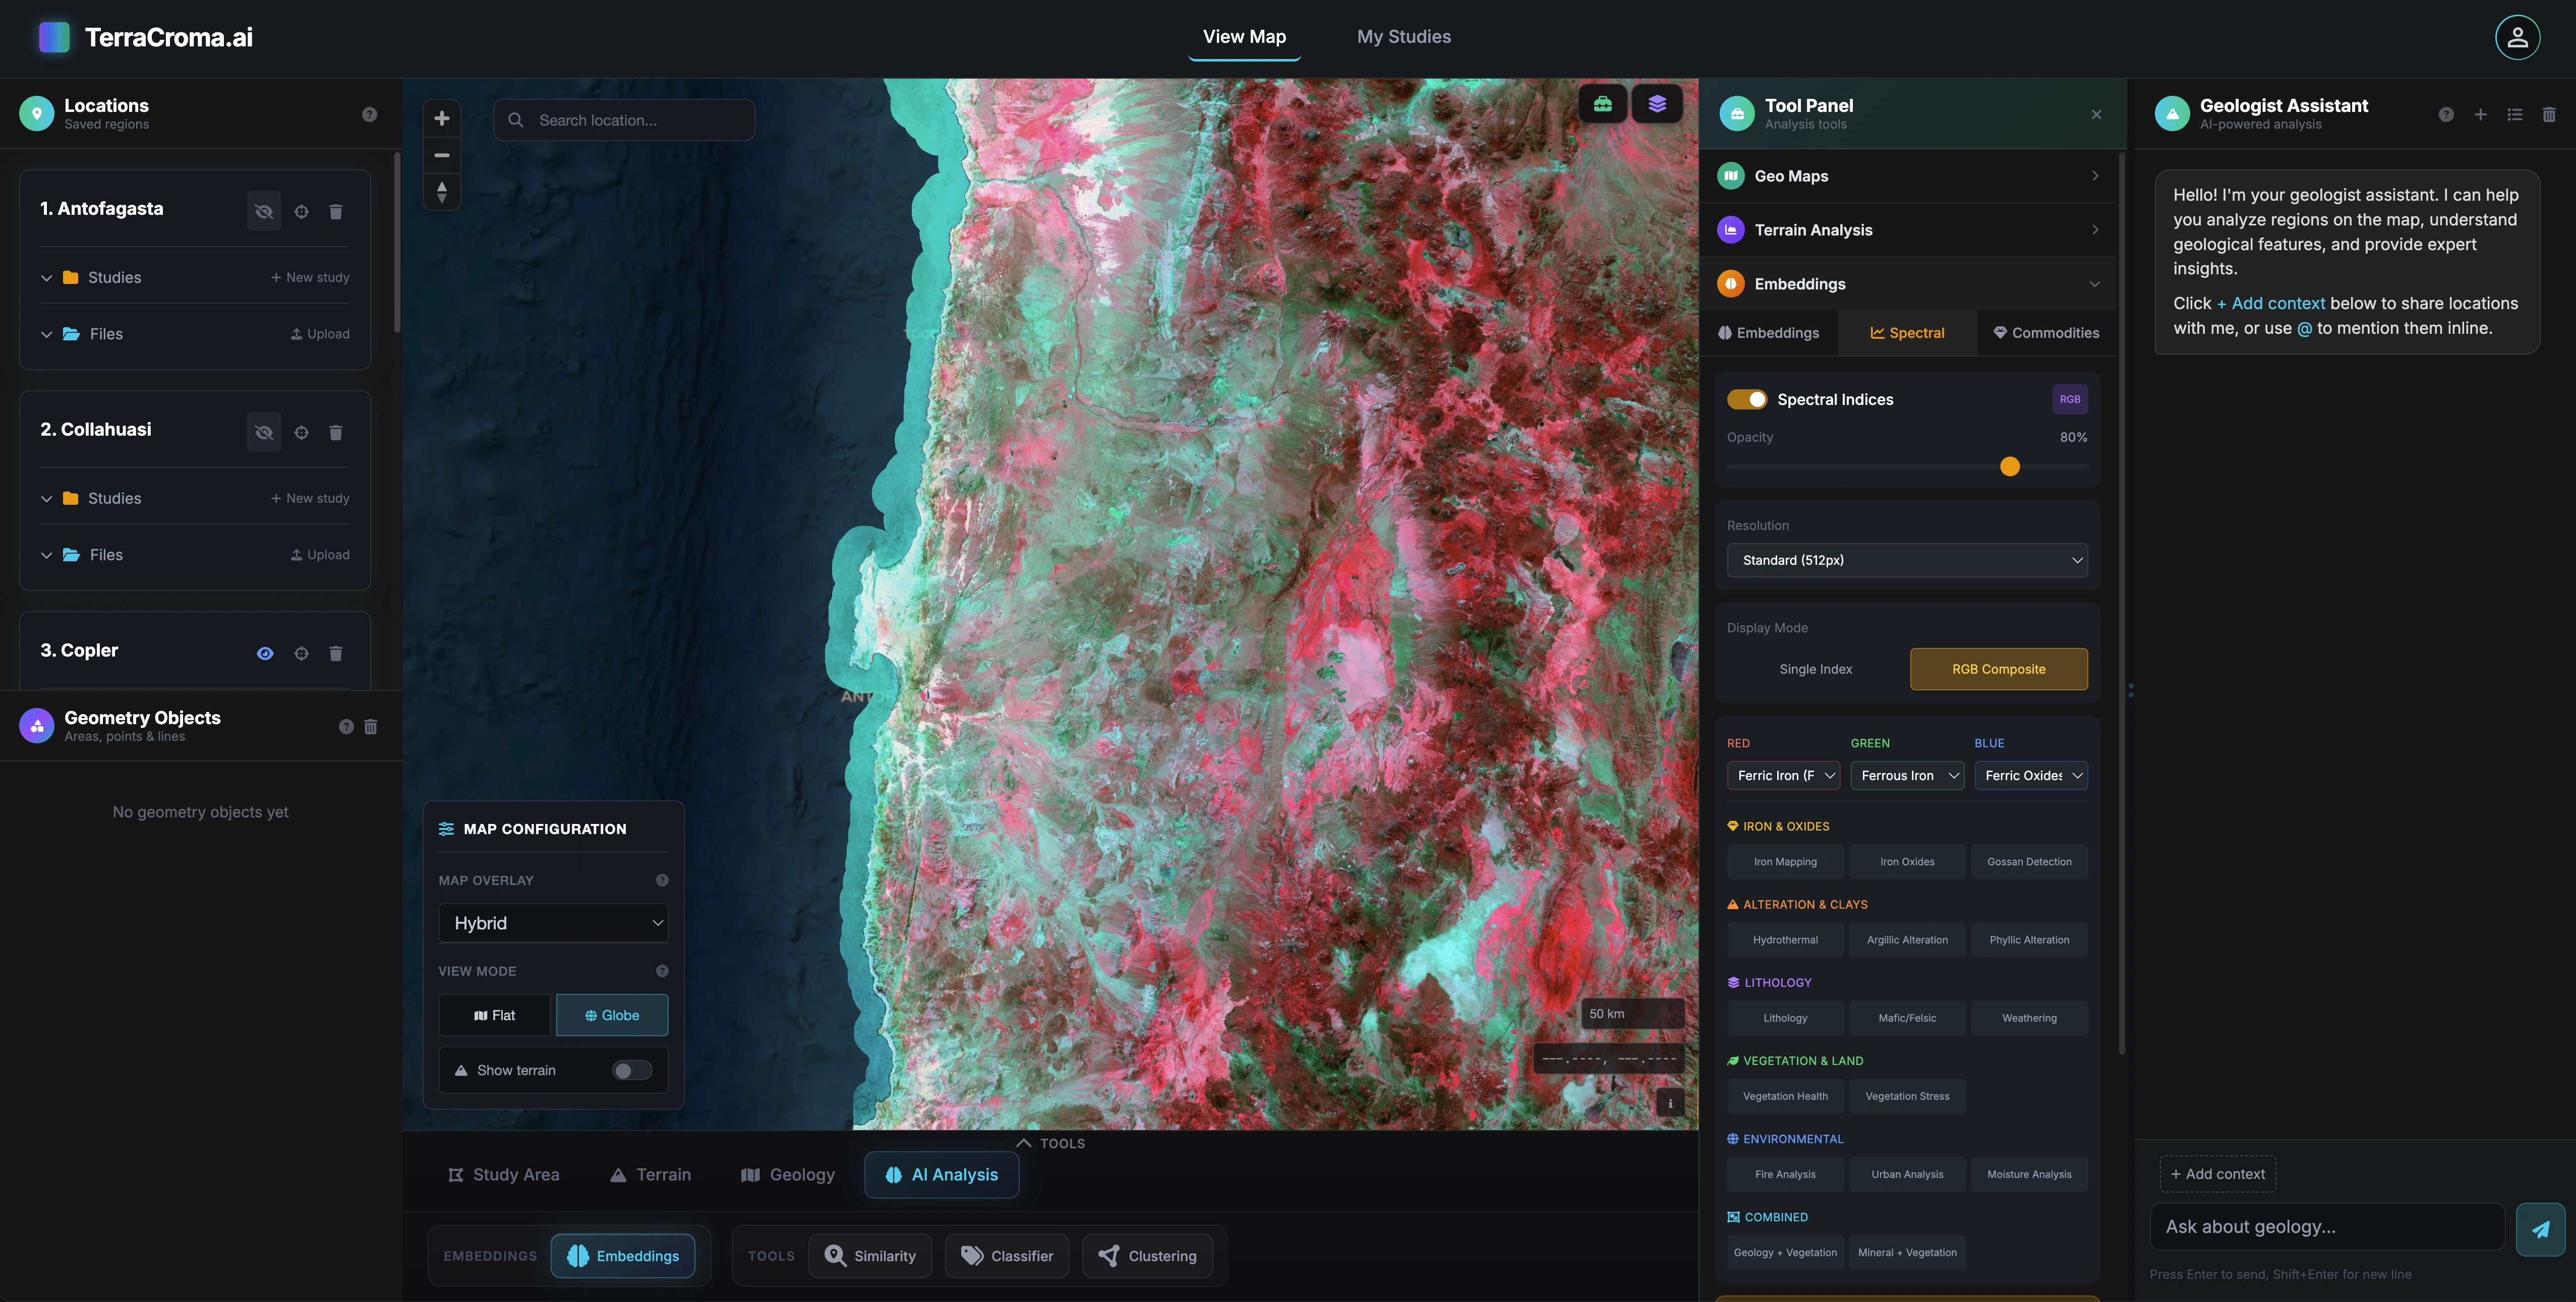
Iron-oxide composite projected at planetary scale

Iron-oxide composite, projected globally

An RGB iron-oxide composite An RGB iron-oxide composite applied at regional scale via AI spectral matching. What used to require dozens of scene downloads now runs in seconds.

Custom classifier training

Train your own classifier

Draw ROIs, train, predict across the full scene. Your labels, your model.

Global similarity search

A pre-computed spectral fingerprint for every pixel on Earth. Click a reference, get a ranked similarity heatmap.

Unsupervised clustering

Automatic grouping of spectral patterns. Discover lithology and land-cover classes with no labels.

Train your own classifier

Draw ROIs, hit train, get probability maps and per-class predictions across the full scene.

Index projection

Compute any spectral index at planetary scale. No scene download required.

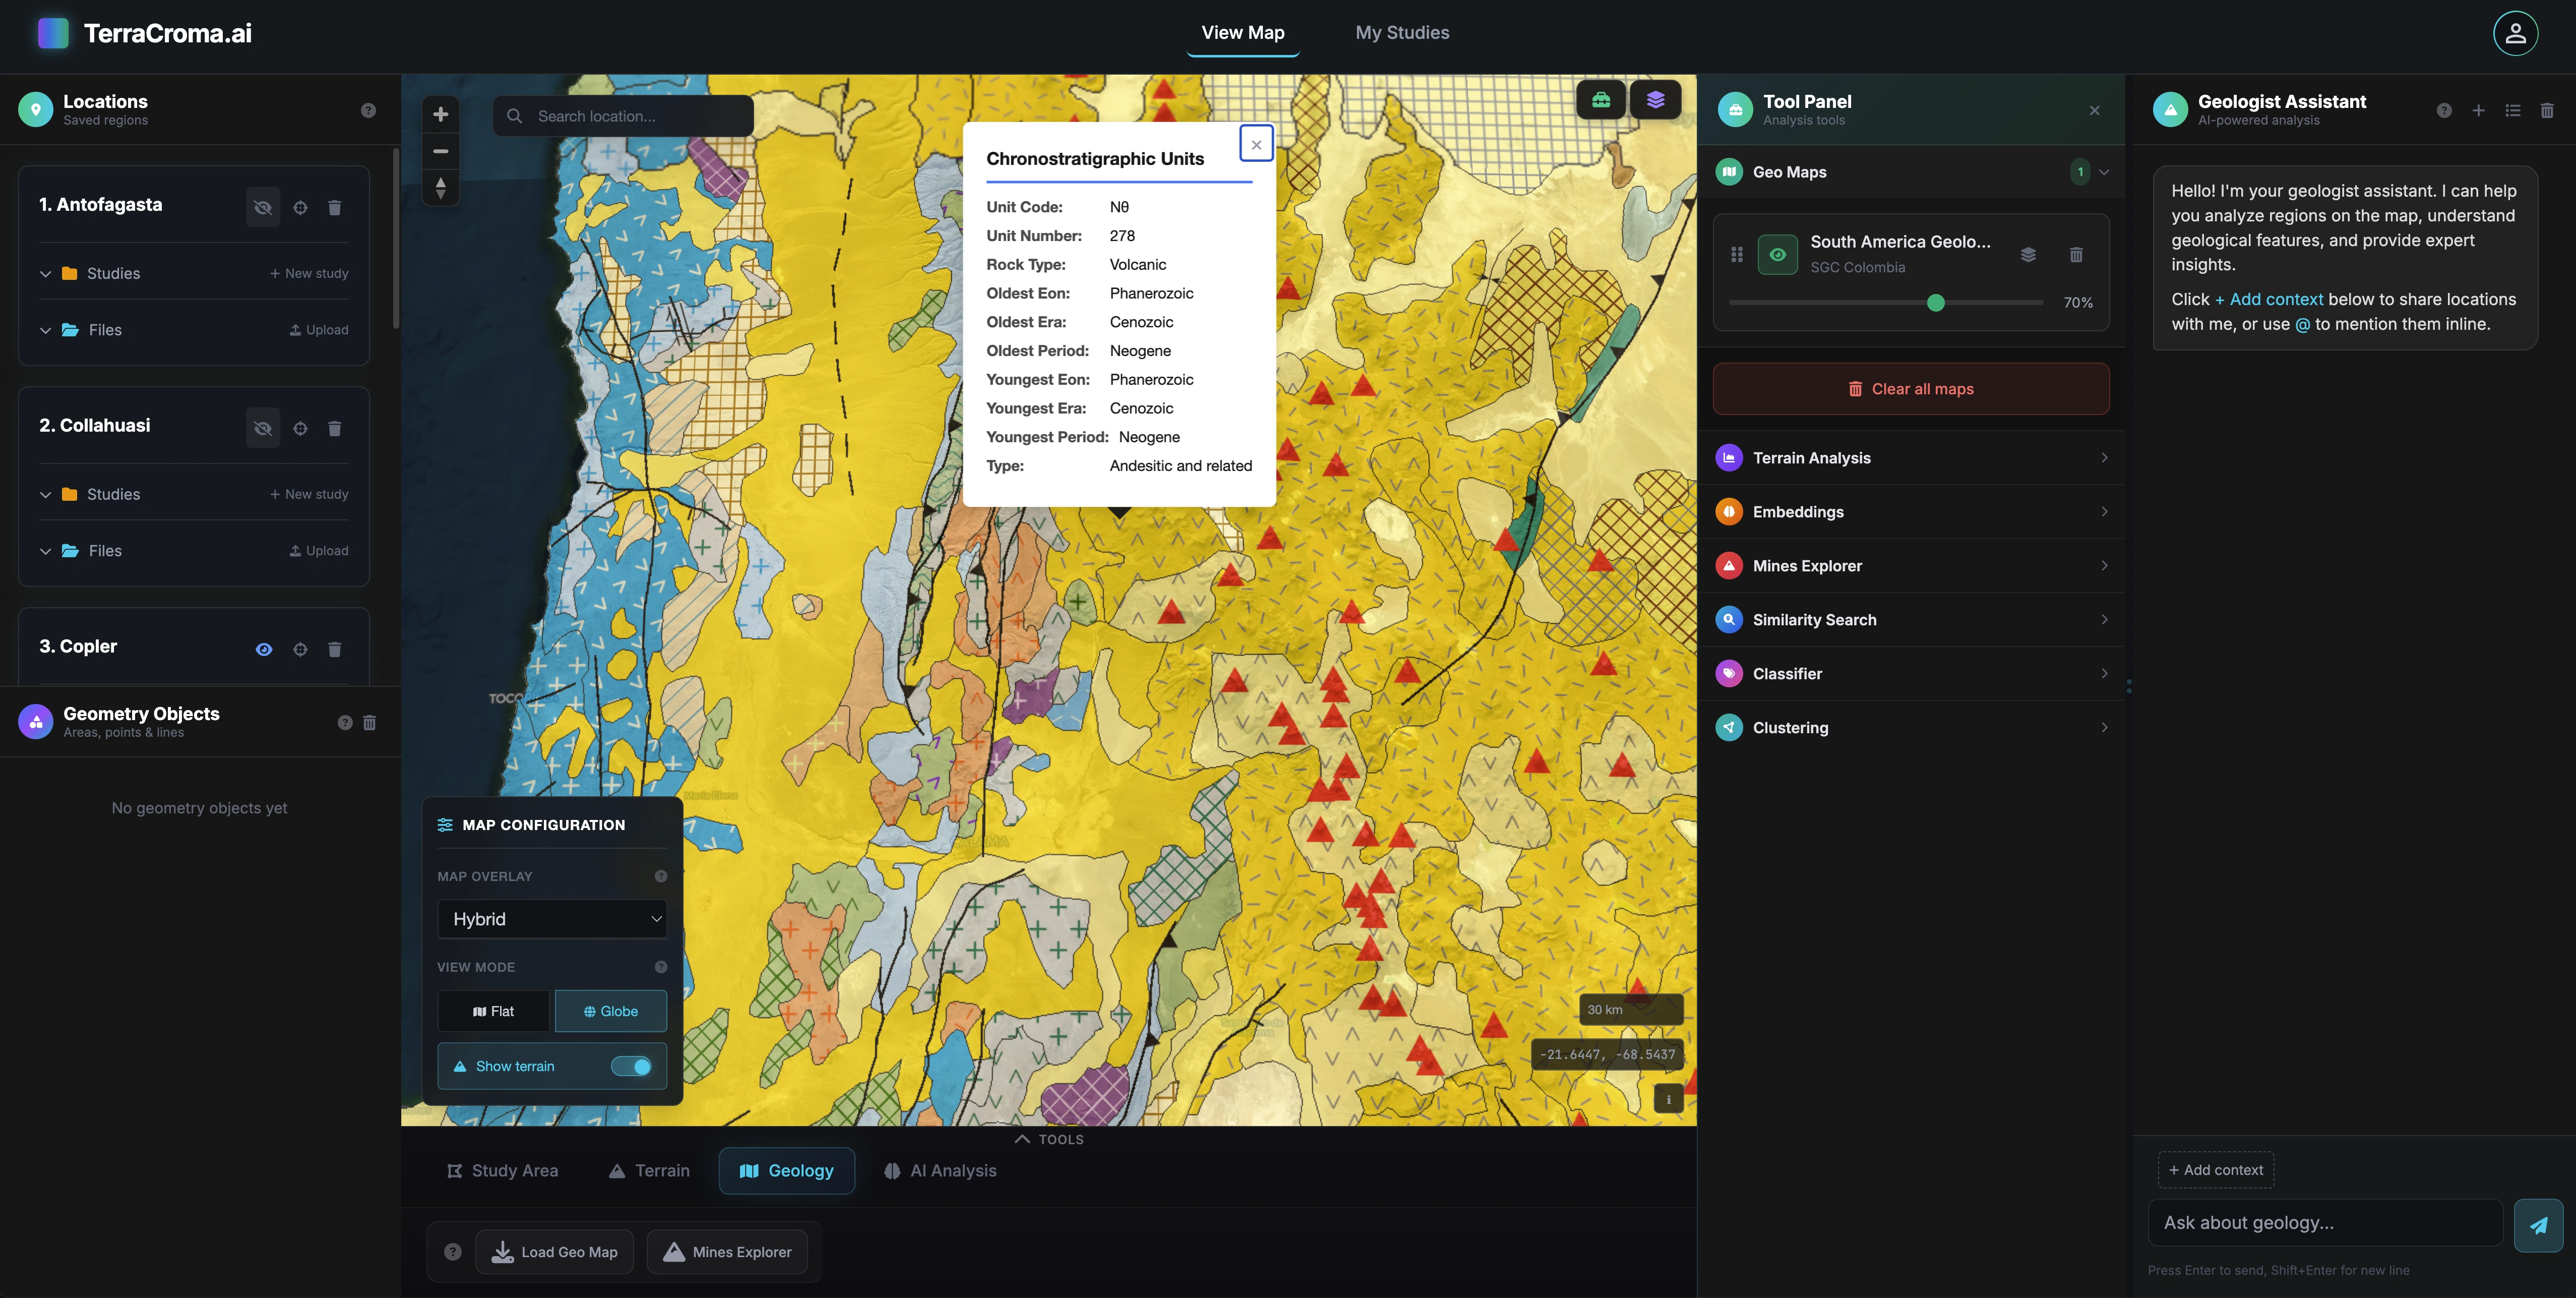
Geological map overlay

Geological overlays + deposit pins

Federated WMS / WFS / ArcGIS layers stacked with our 12,000-deposit database.

12k+

Mines & deposits

3

Federated standards

Layers stackable

03.4Geological Maps & Deposits

Every map, every deposit, on the same canvas.

Pull regional geological maps from any WFS, WMS or ArcGIS service and overlay them with our 12,000+ deposit database. Filter by commodity, mineral or rock type. Query attributes with one click.

  • WFS / WMS / ArcGIS proxies: Vector contacts, faults and folds plus raster geology rendered natively in the map.

  • Commodity filtering: Show only Cu, Au, Li, Fe oxide deposits, or any mineral / rock association.

  • Identify & query: Click any feature for full attribute inspection: lithology code, age, source.

  • Favorability grids: Convert lithology polygons and fault lines into quantitative evidence layers for prospectivity.

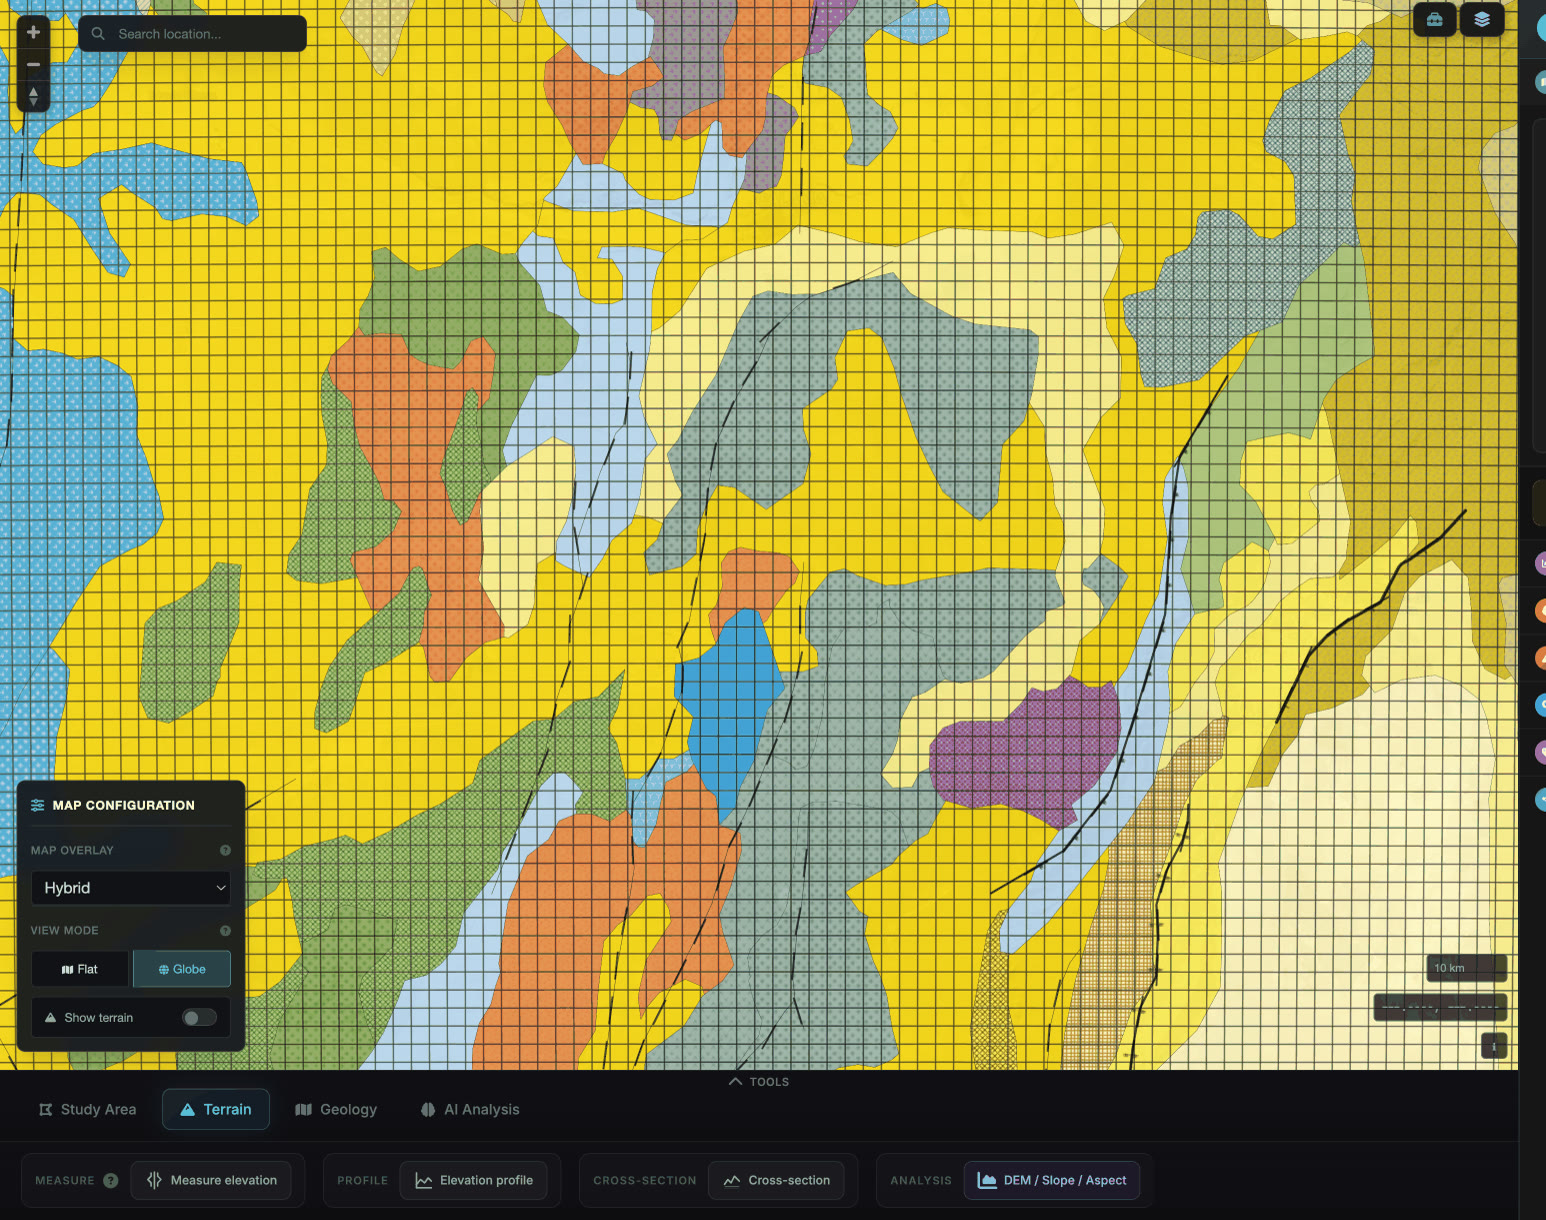
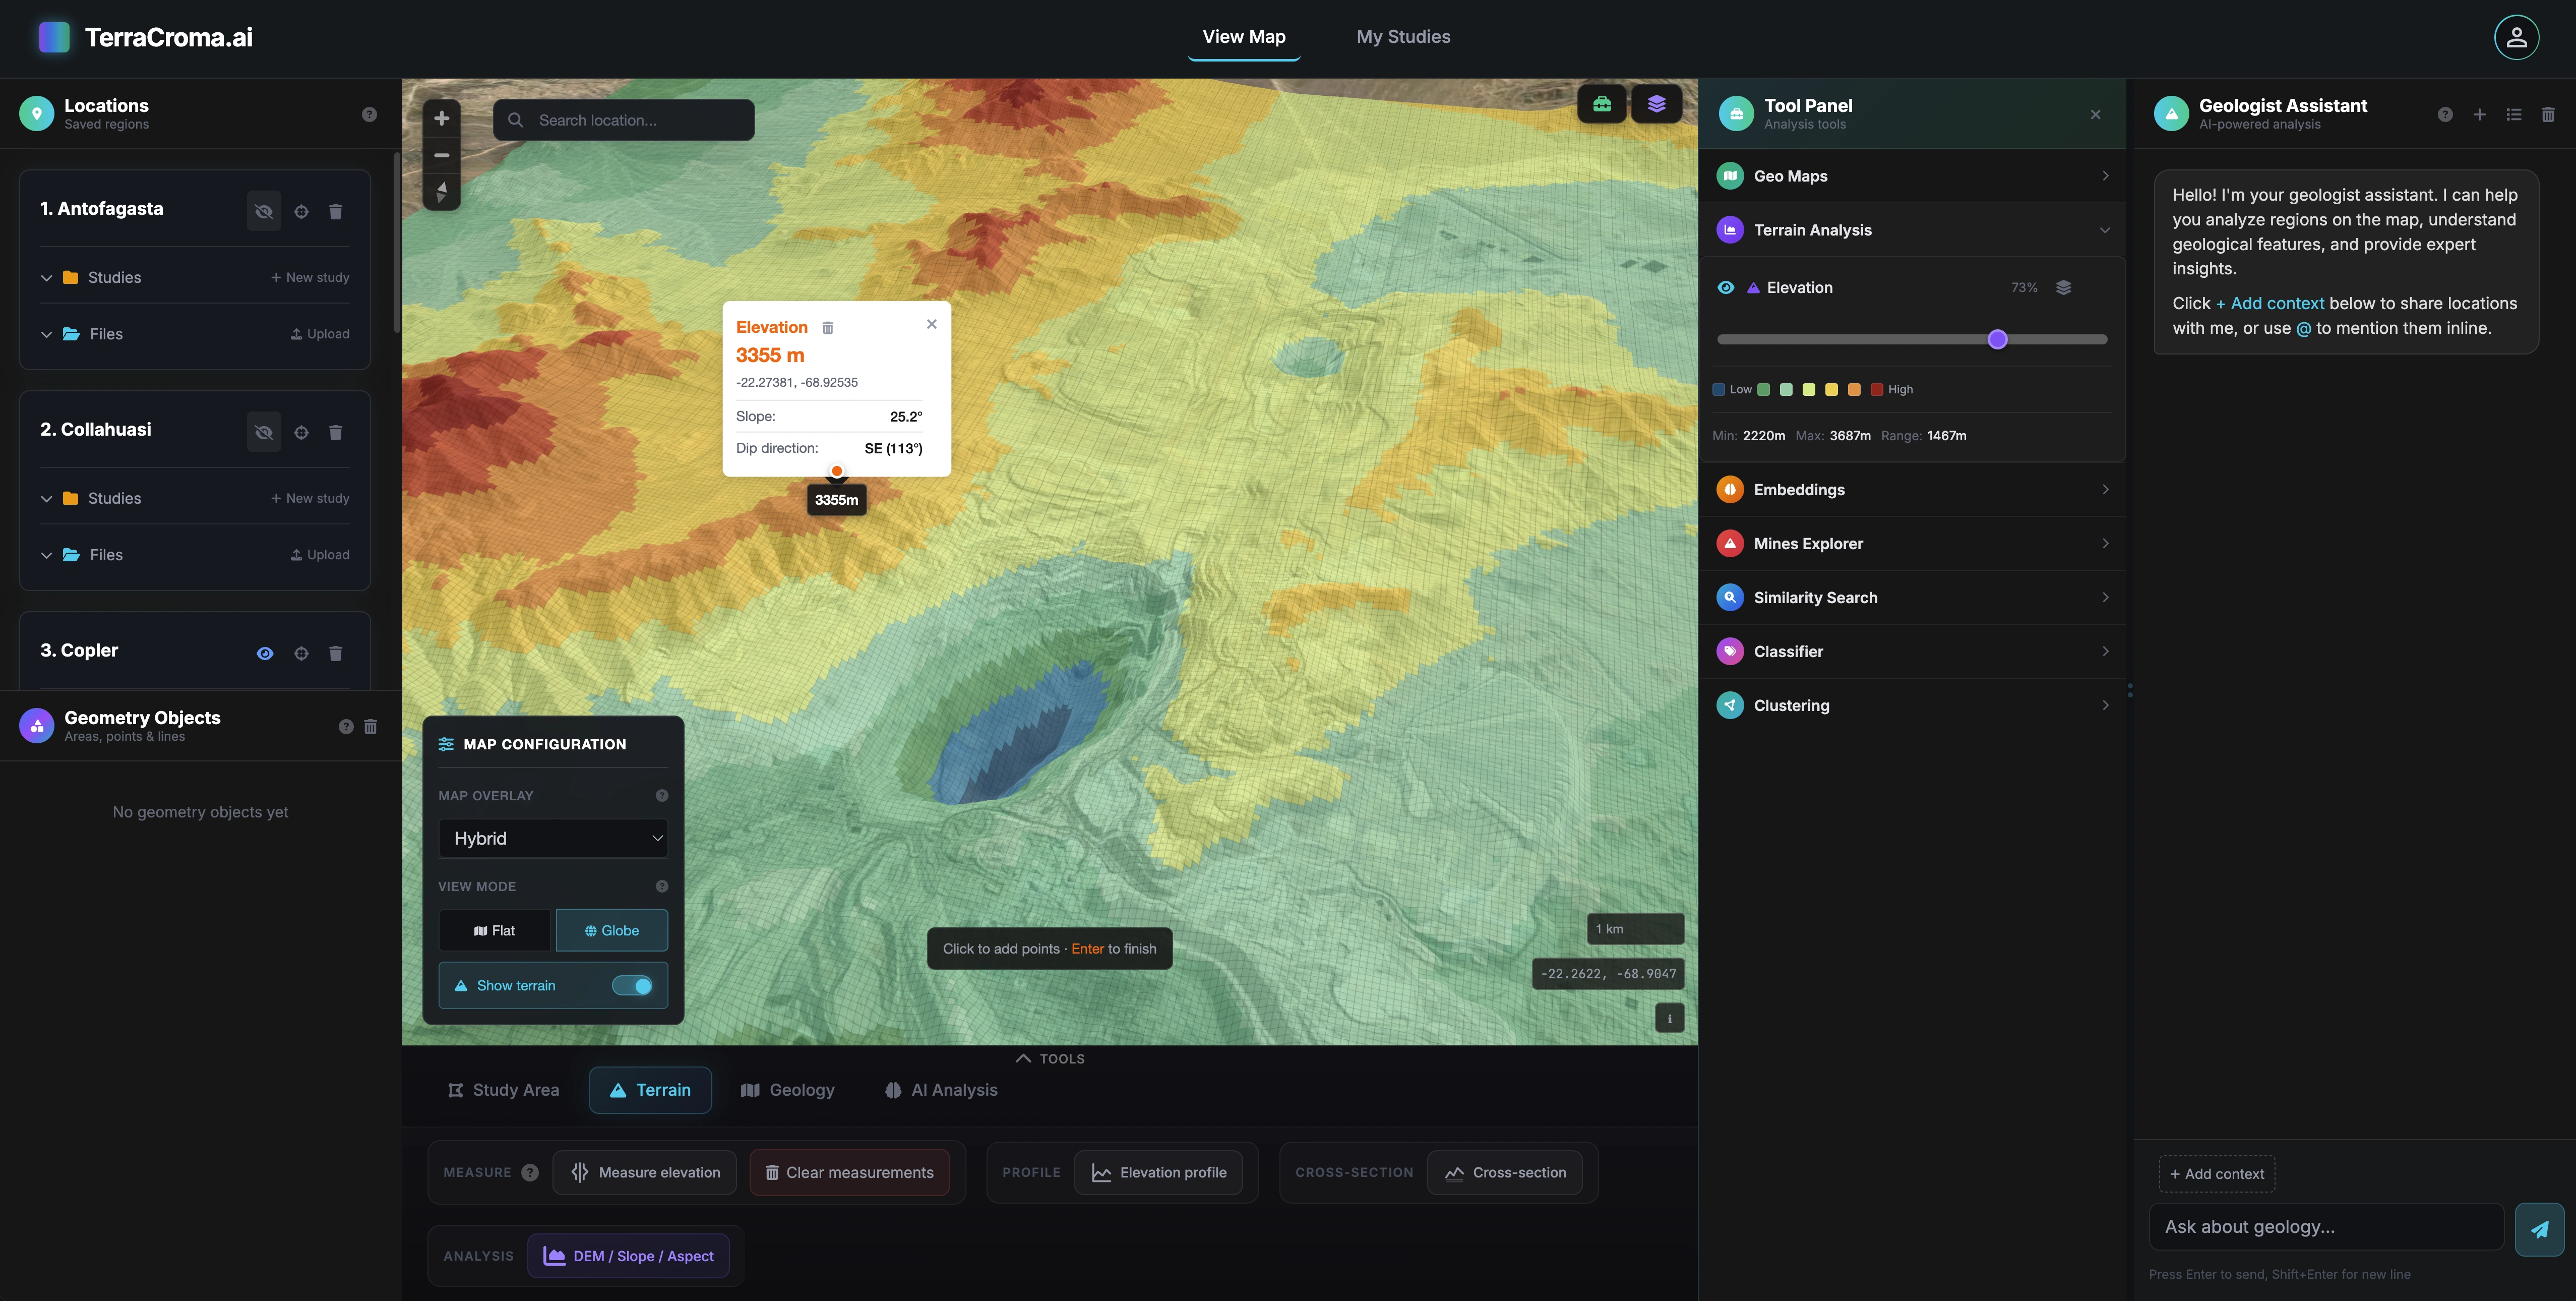
03.5Terrain & Cross-Sections

Terrain analysis & geological cross-sections.

Slope, aspect and shaded-relief from global DEMs, plus draw-a-line cross-sections that return both an elevation profile and the lithology stack along the transect.

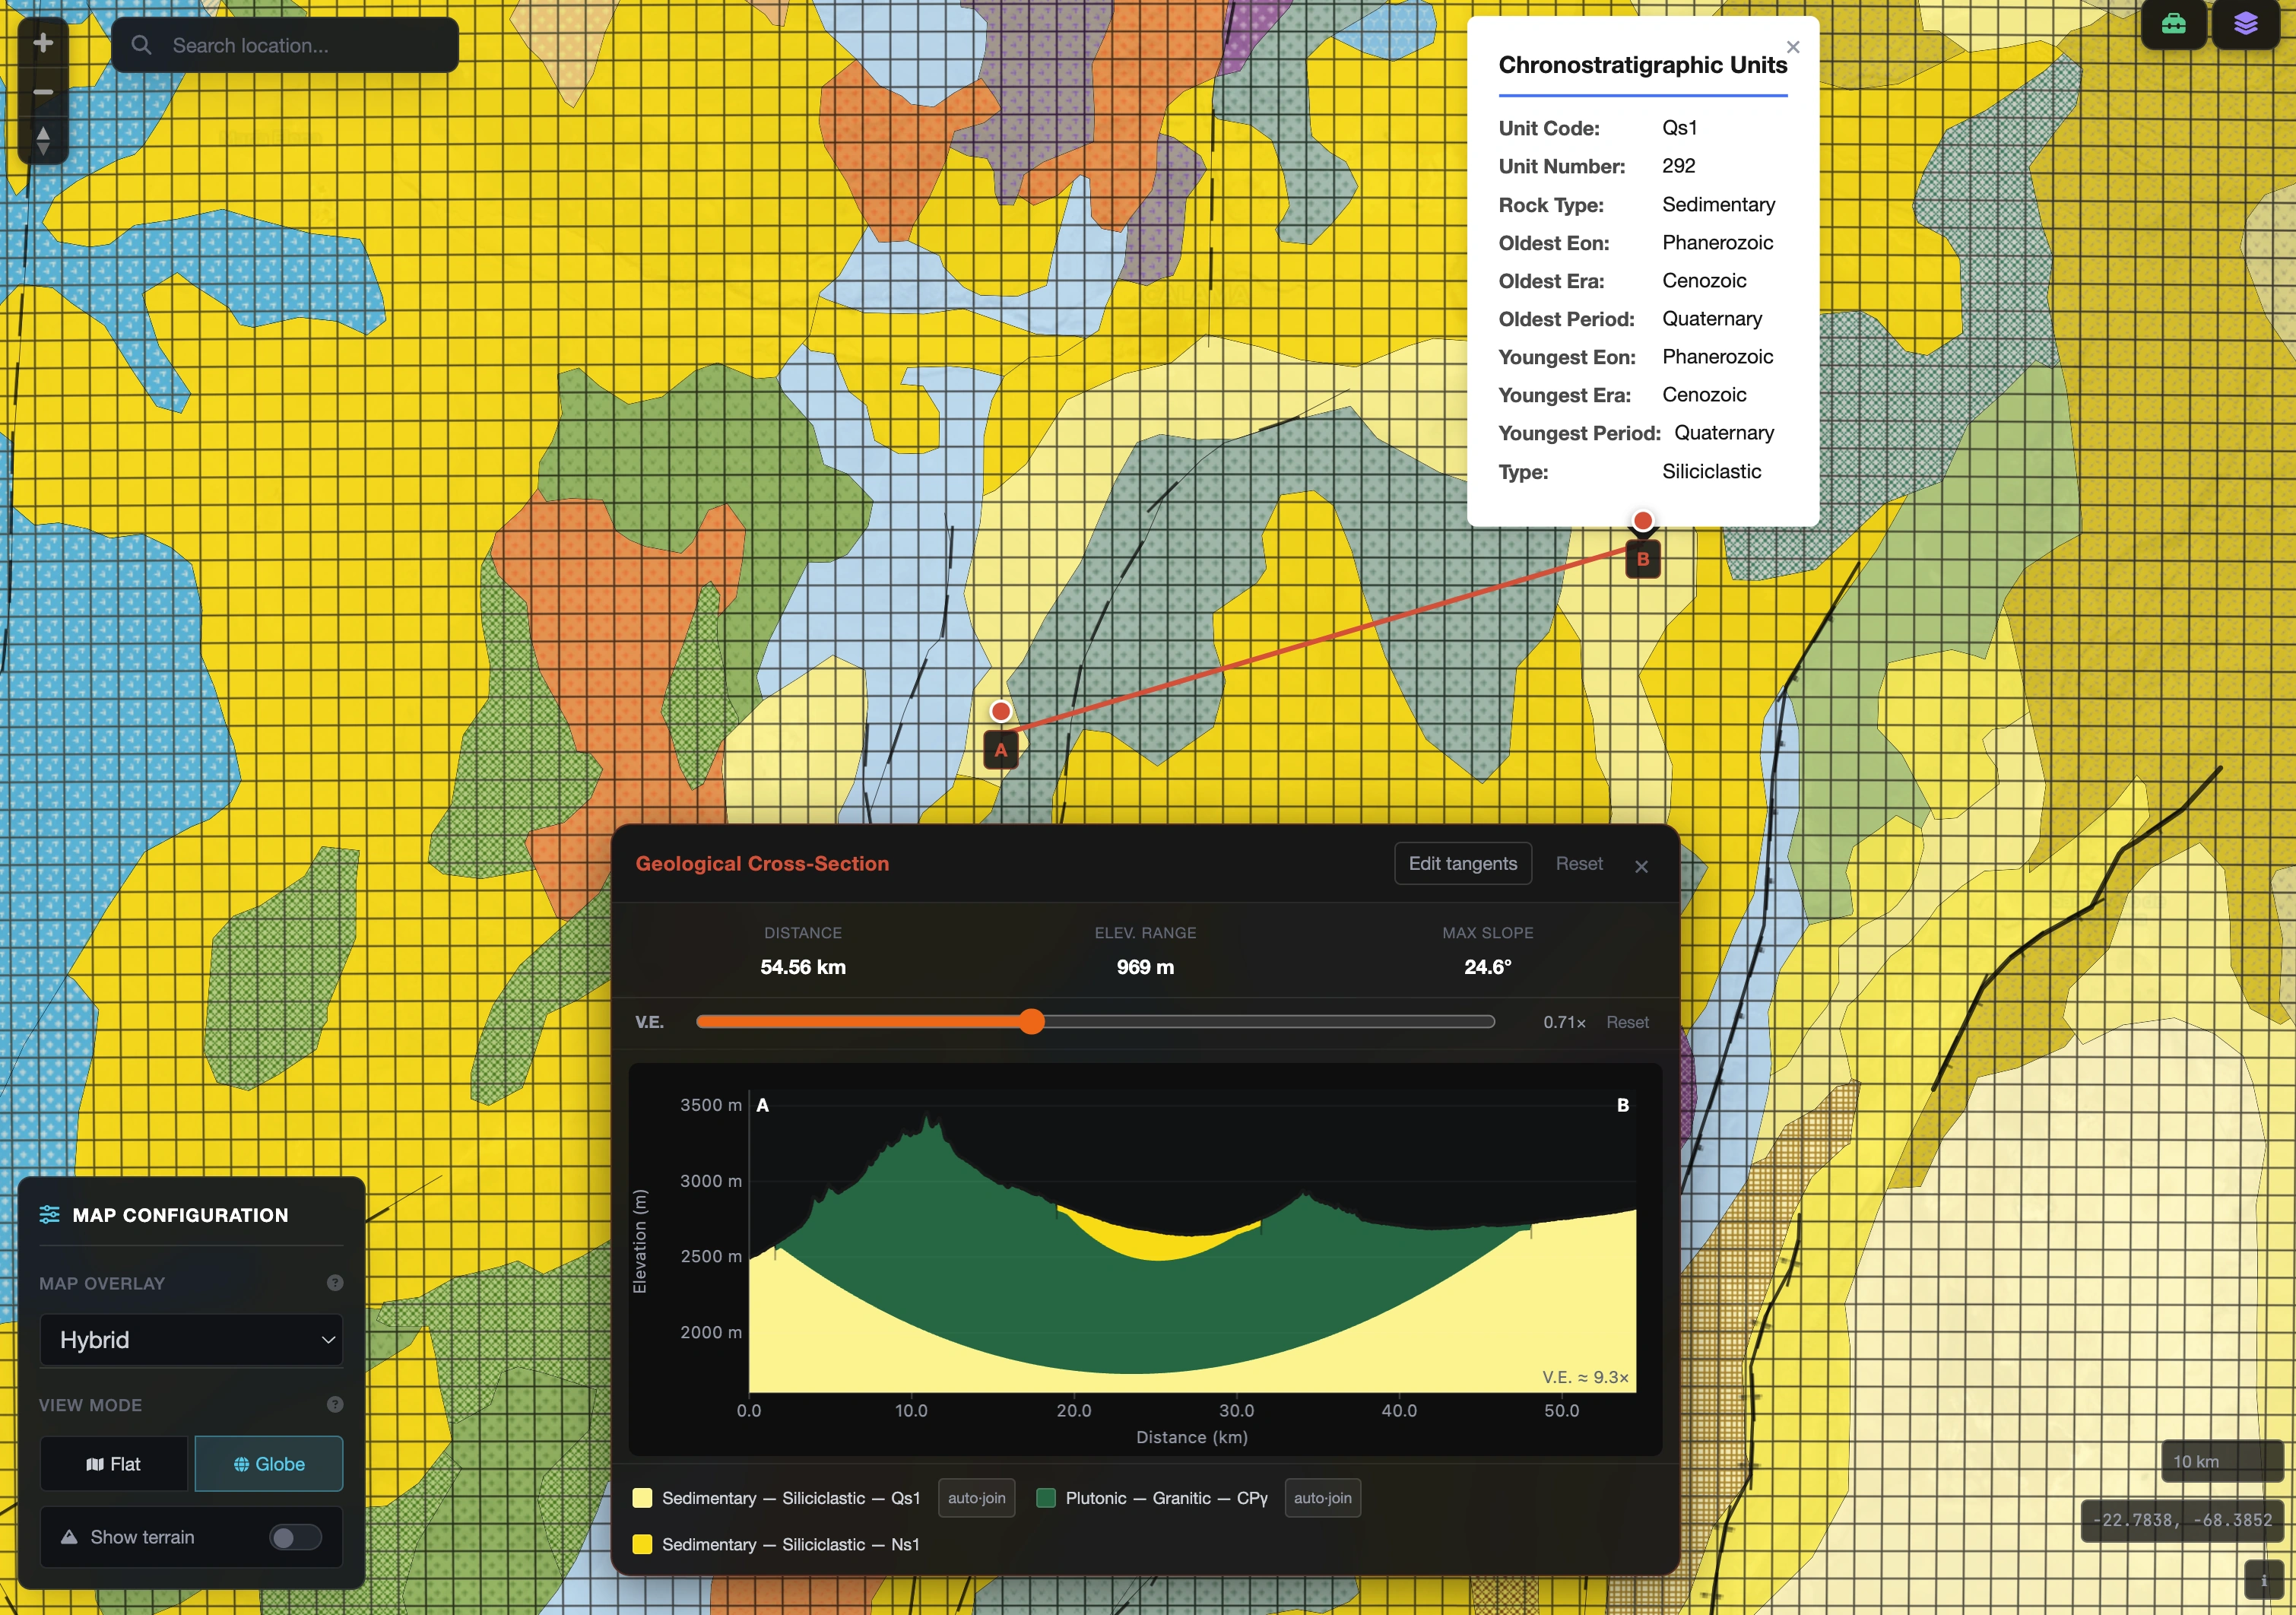
Geological cross-section

Draw a line. Get elevation profile and lithology stack along the transect.

Static cross-section

Cross-section snapshot

Rendered profile, ready for reports and stakeholder presentations.

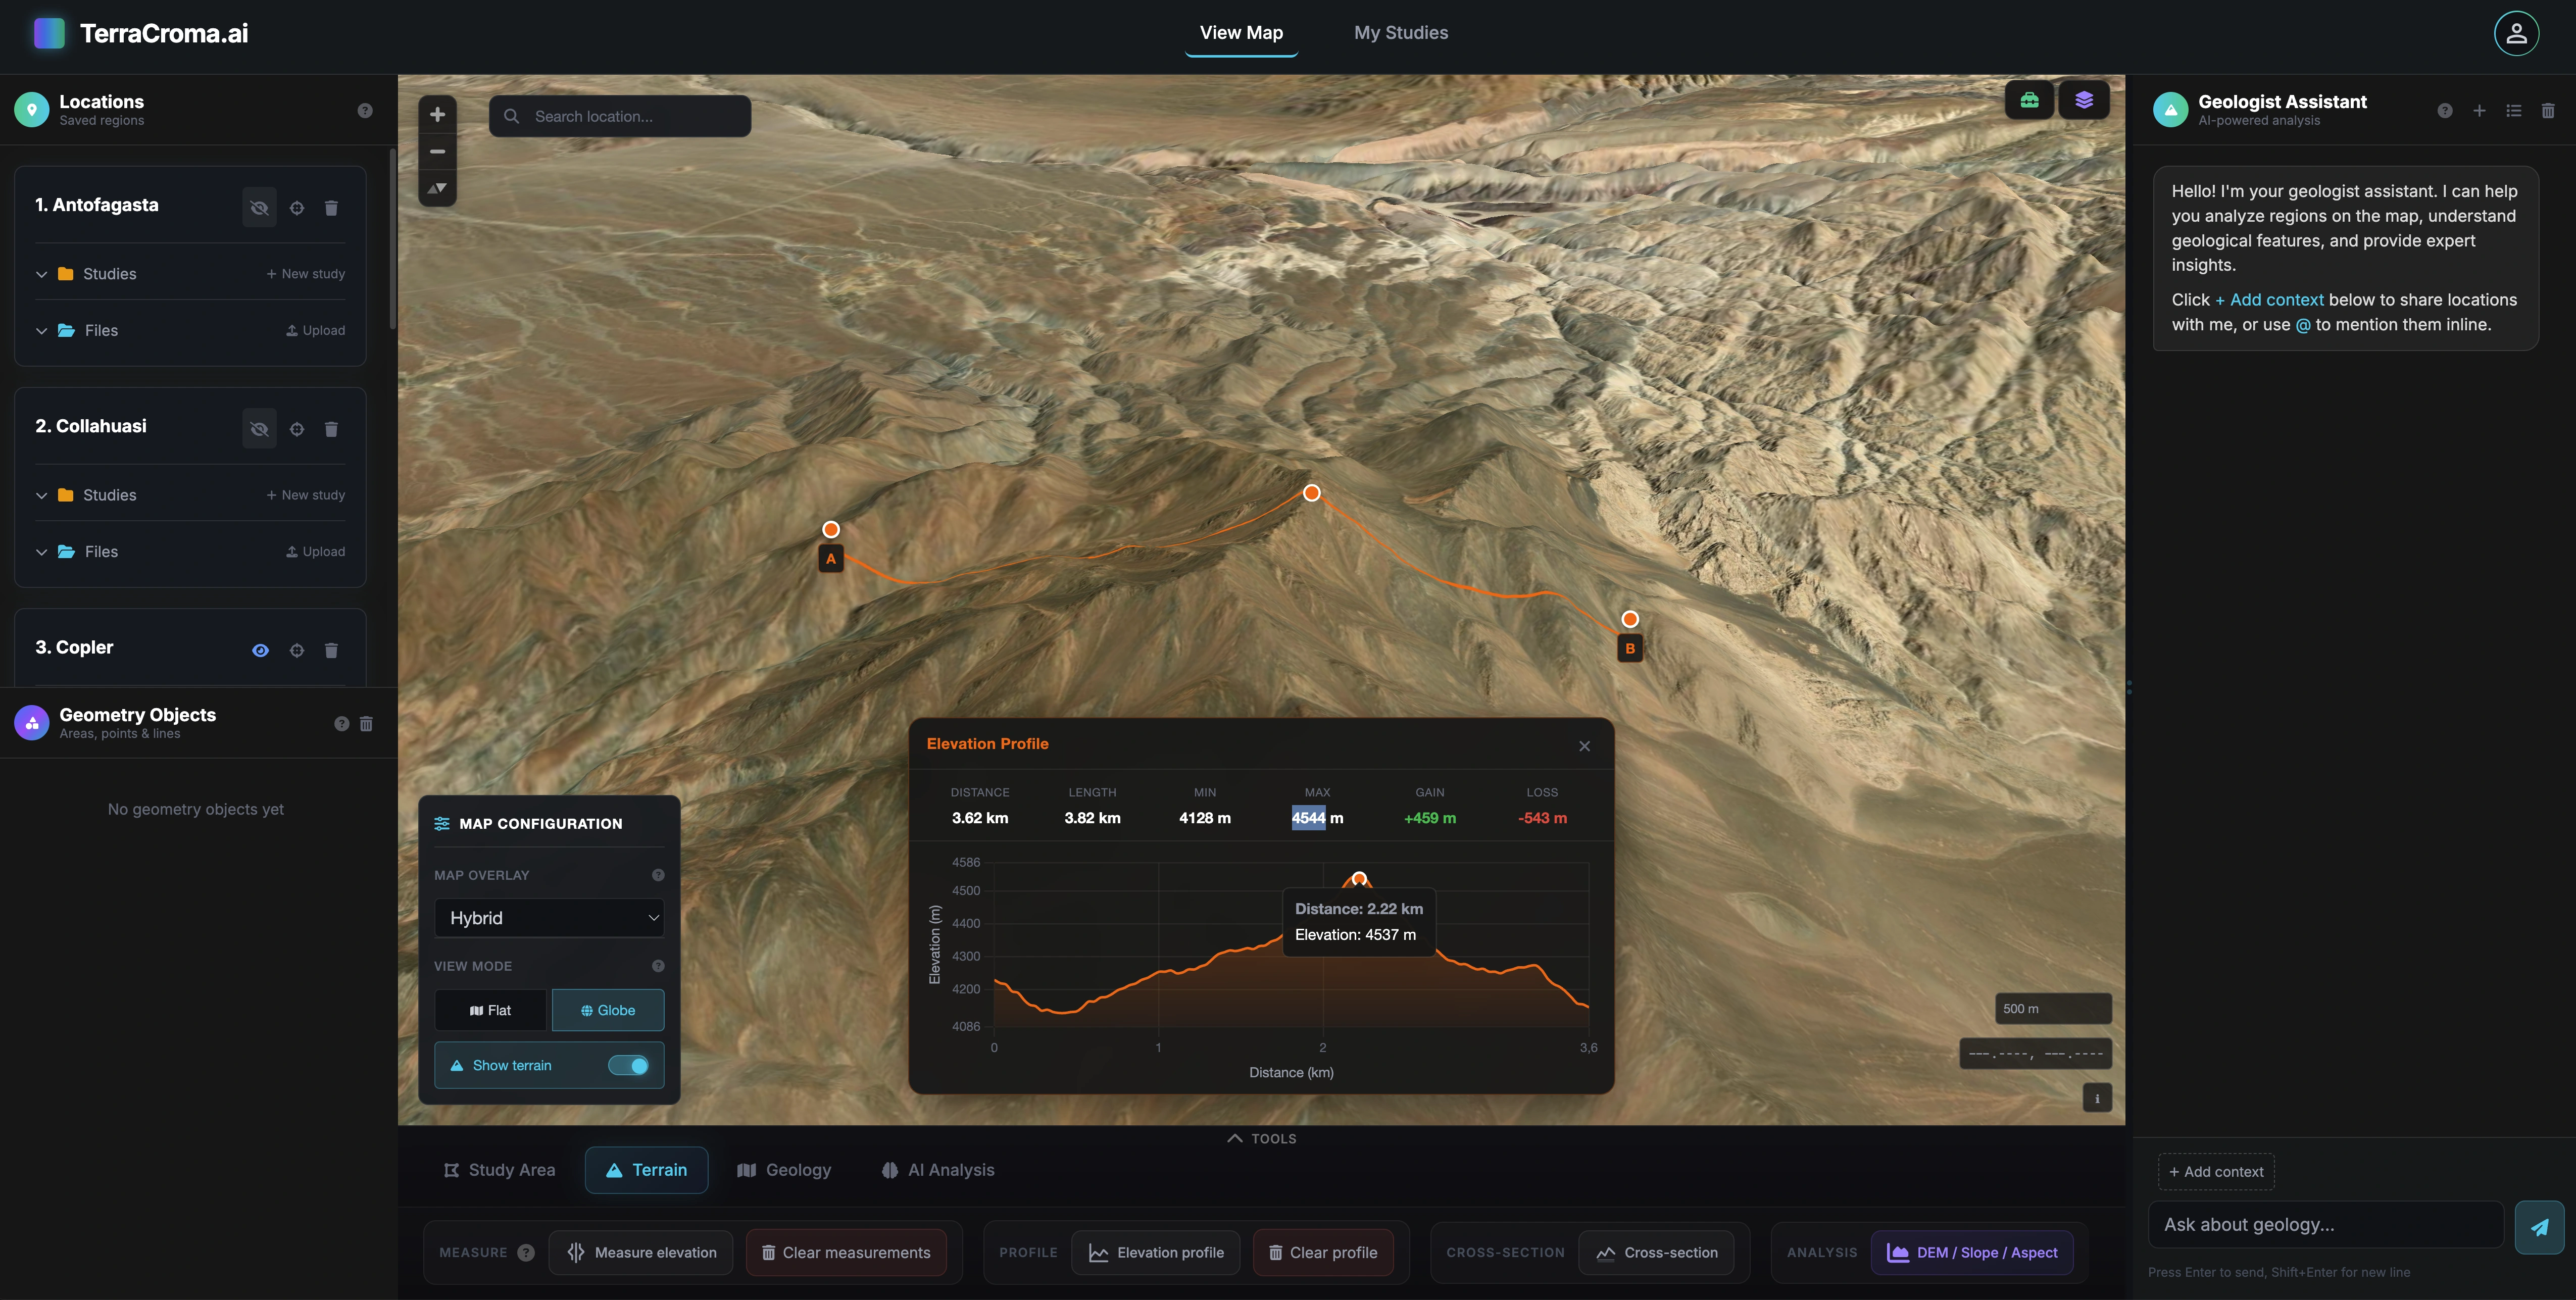
Elevation profile

Elevation profile

Sampled at ~30 m, with distance and gradient ready for export.

Elevation map

Elevation & relief map

Hillshaded terrain from global DEM providers. Slope and aspect available as derived layers.

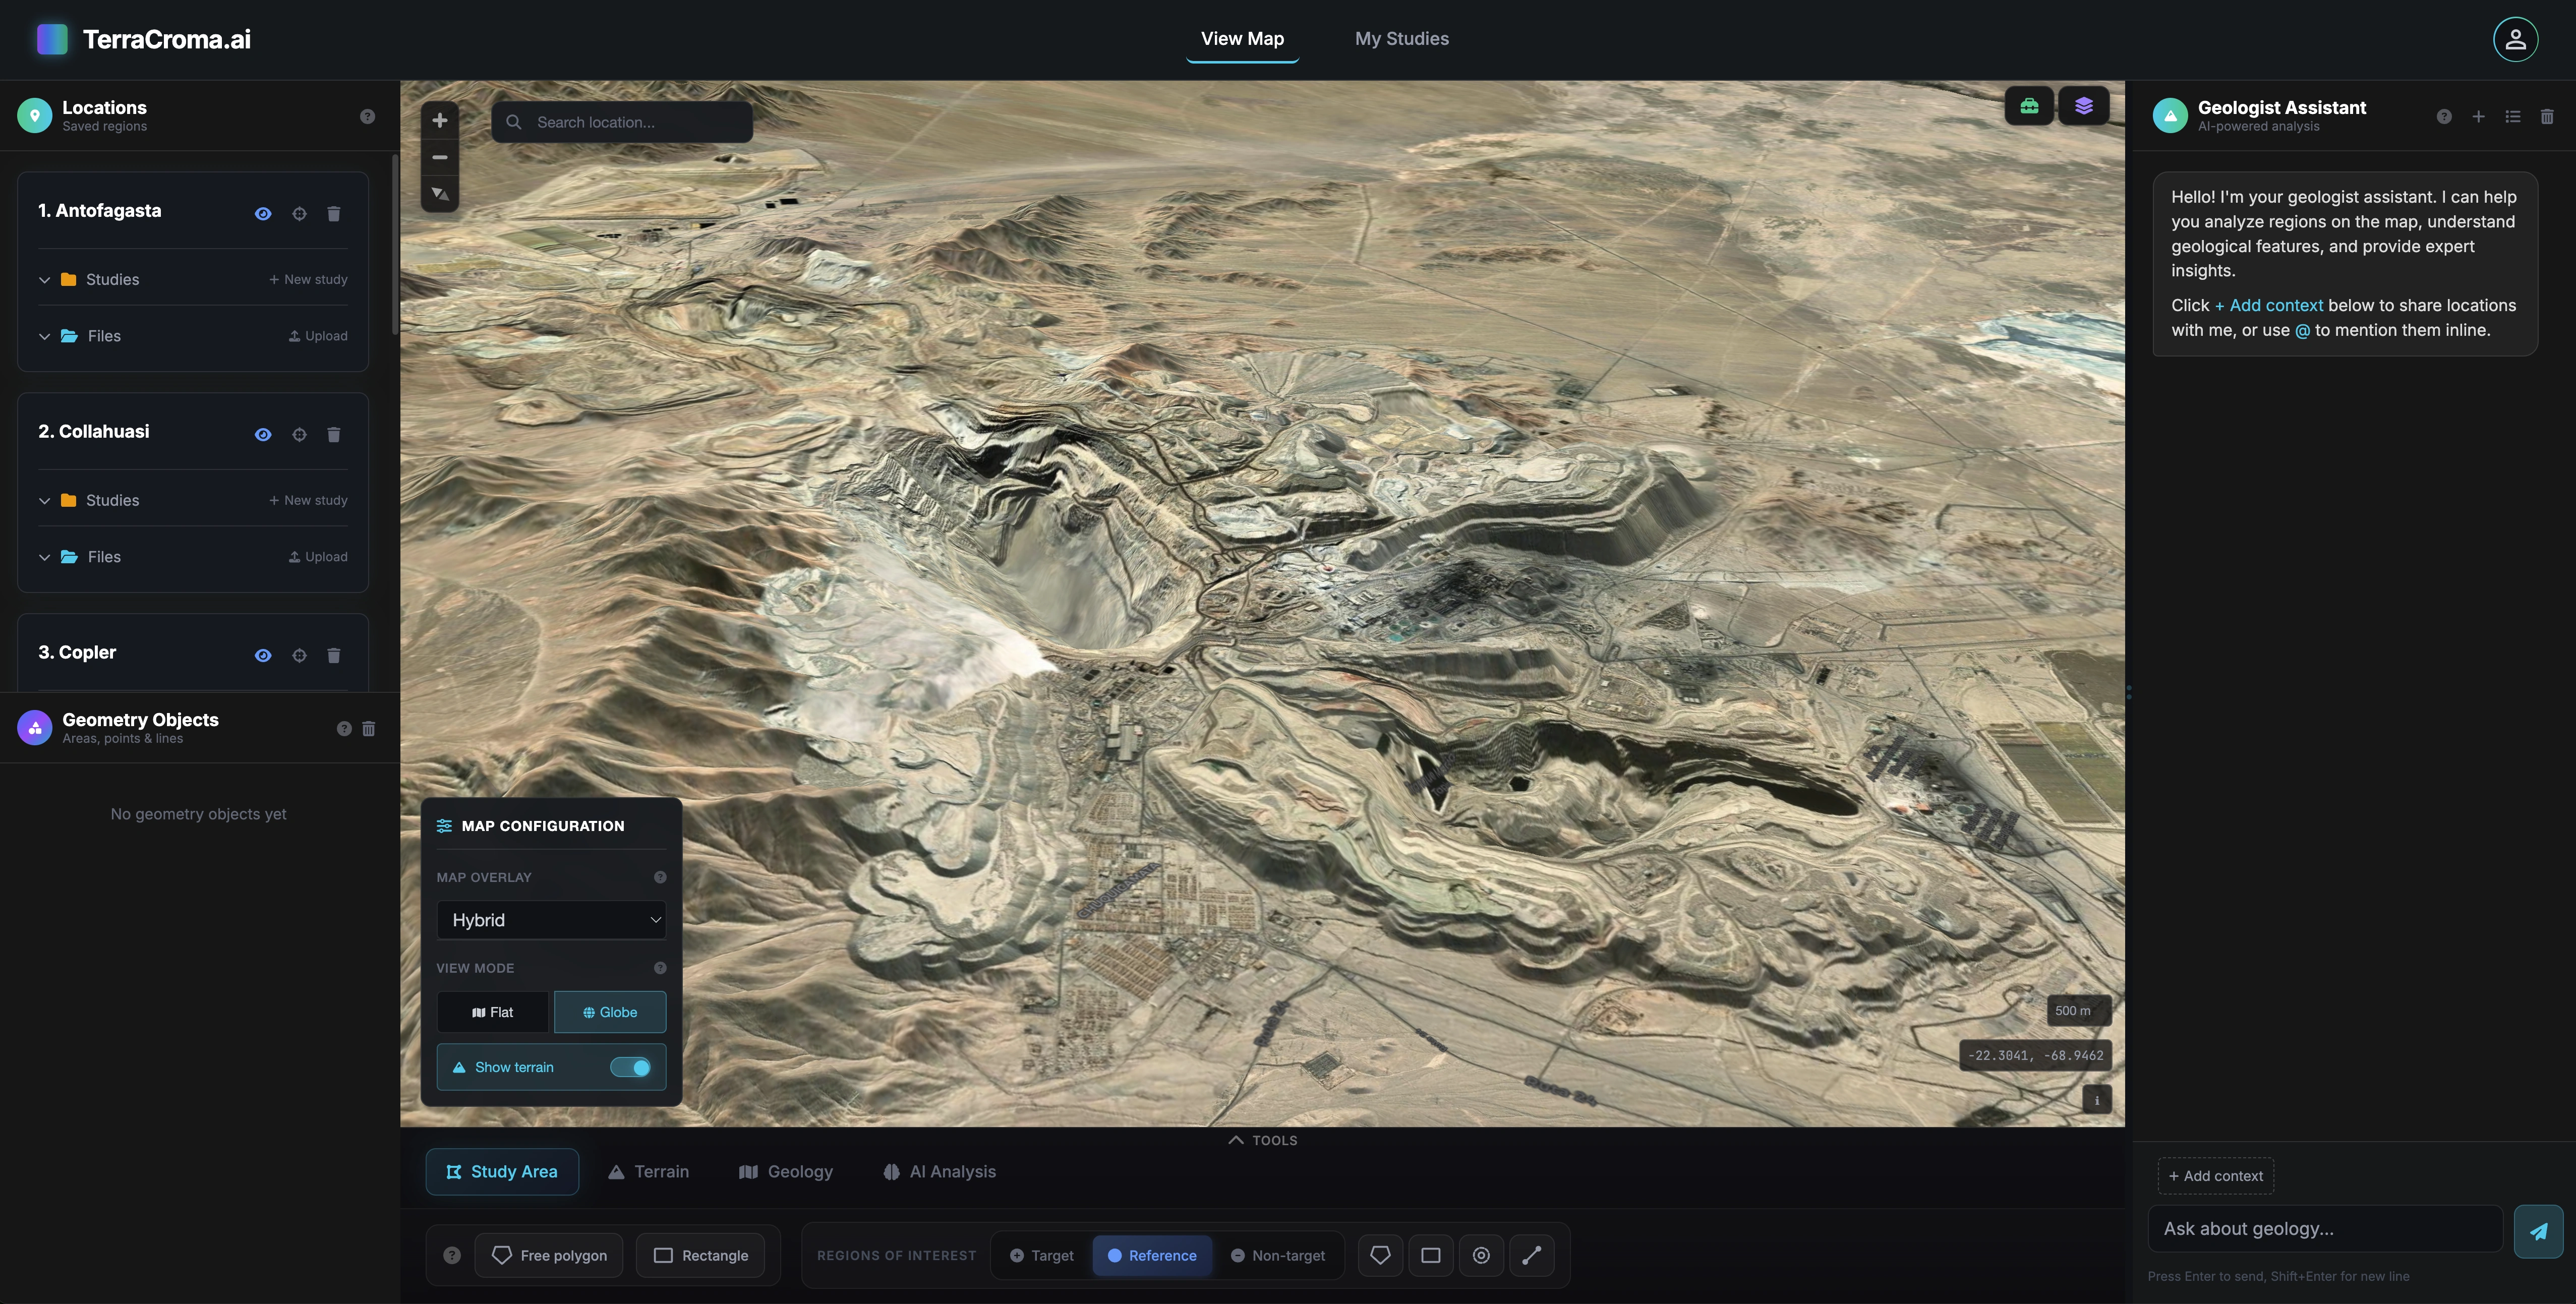
3D layered visualization

3D layered visualization

Stack spectral, structural and terrain layers in three dimensions for spatial reasoning.

Elevation queries

Point or grid lookups against AWS, Mapbox & MapTiler DEMs.

Elevation profile

Auto-sampled at ~30 m, distance and gradient ready for export.

Geological section

Lithology stacked vertically along the same transect line.

Slope & aspect grids

Heatmaps for terrain favorability inputs and visual reads.

03.6Spectral Analysis & Composition

Compute indices. Match signatures. Identify composition.

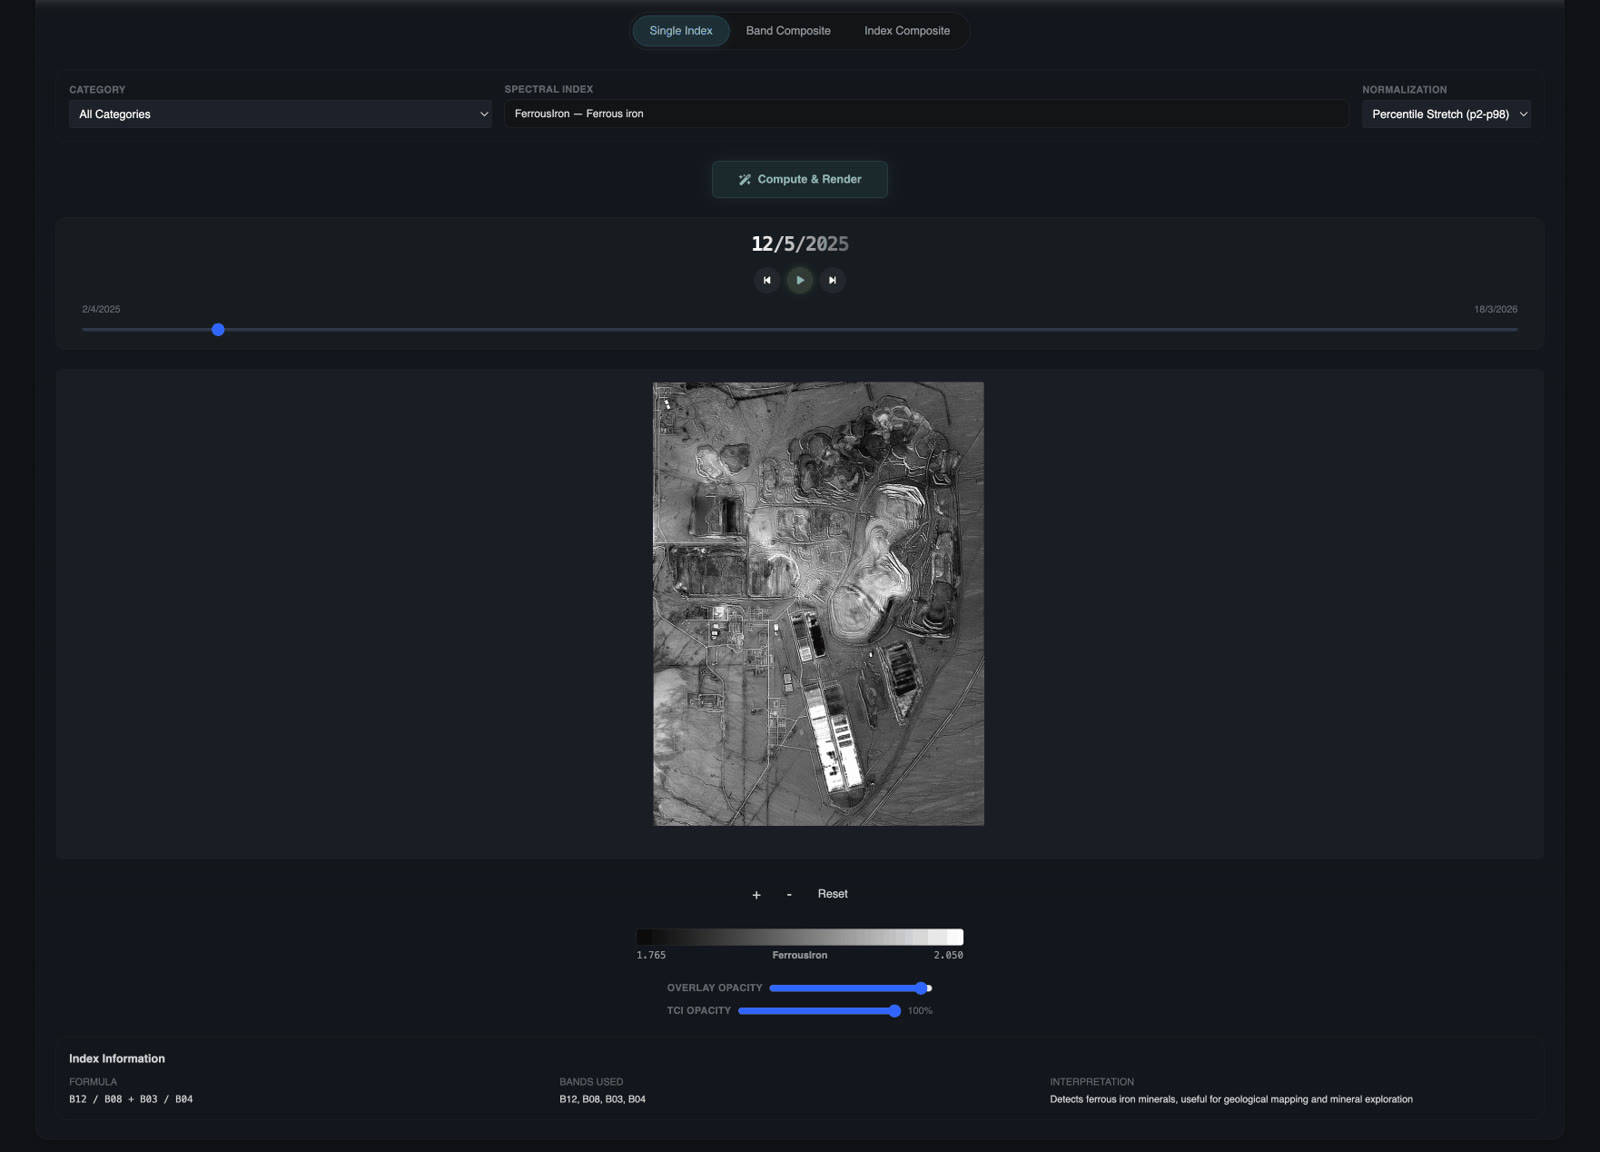
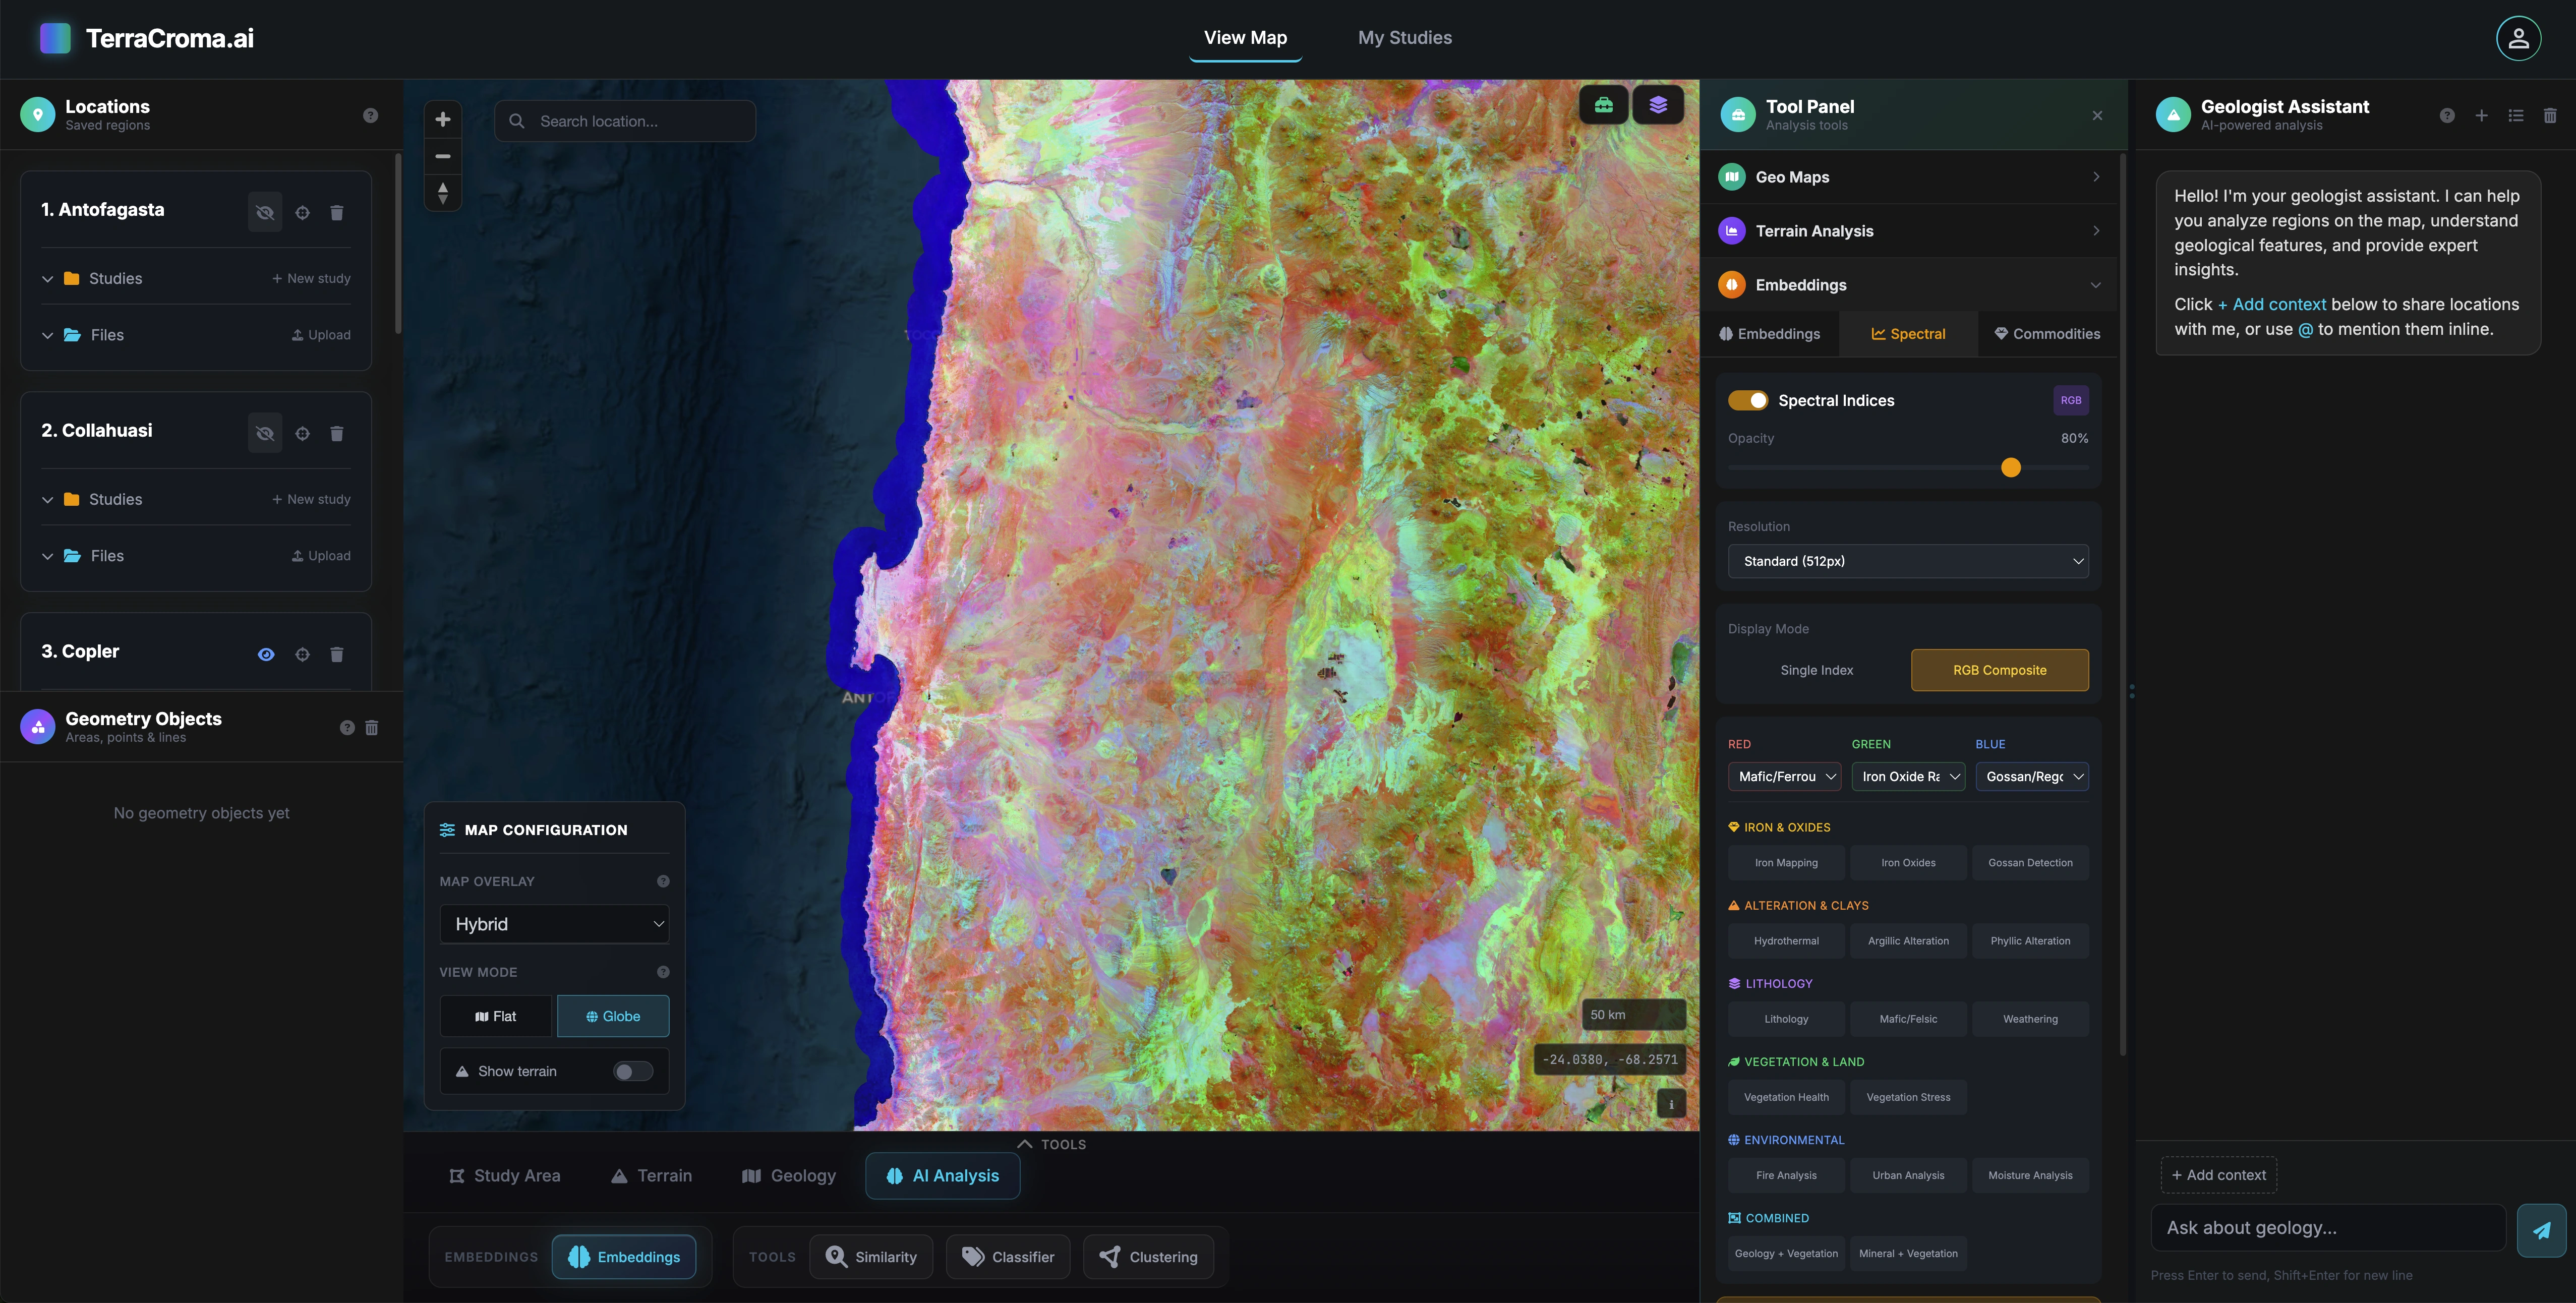
From Sentinel-2 imagery we derive 50+ geological indices (gossan, iron oxides, ferric/ferrous, hydrothermal, argillic, phyllic) and match each pixel's spectral fingerprint against the USGS / FIRMS reference library to classify mineral composition directly. Run it once or watch it evolve across years of historic imagery.

  • Mining-first index library: Gossan, Iron Oxide, Ferric/Ferrous, Laterite, Alteration, MCAR, BSI, ARVI and more, computed live over your study area.

  • Spectral library matching: Pick any pixel; its 10-band fingerprint is scored against thousands of reference minerals, vegetation and soils for direct compositional ID.

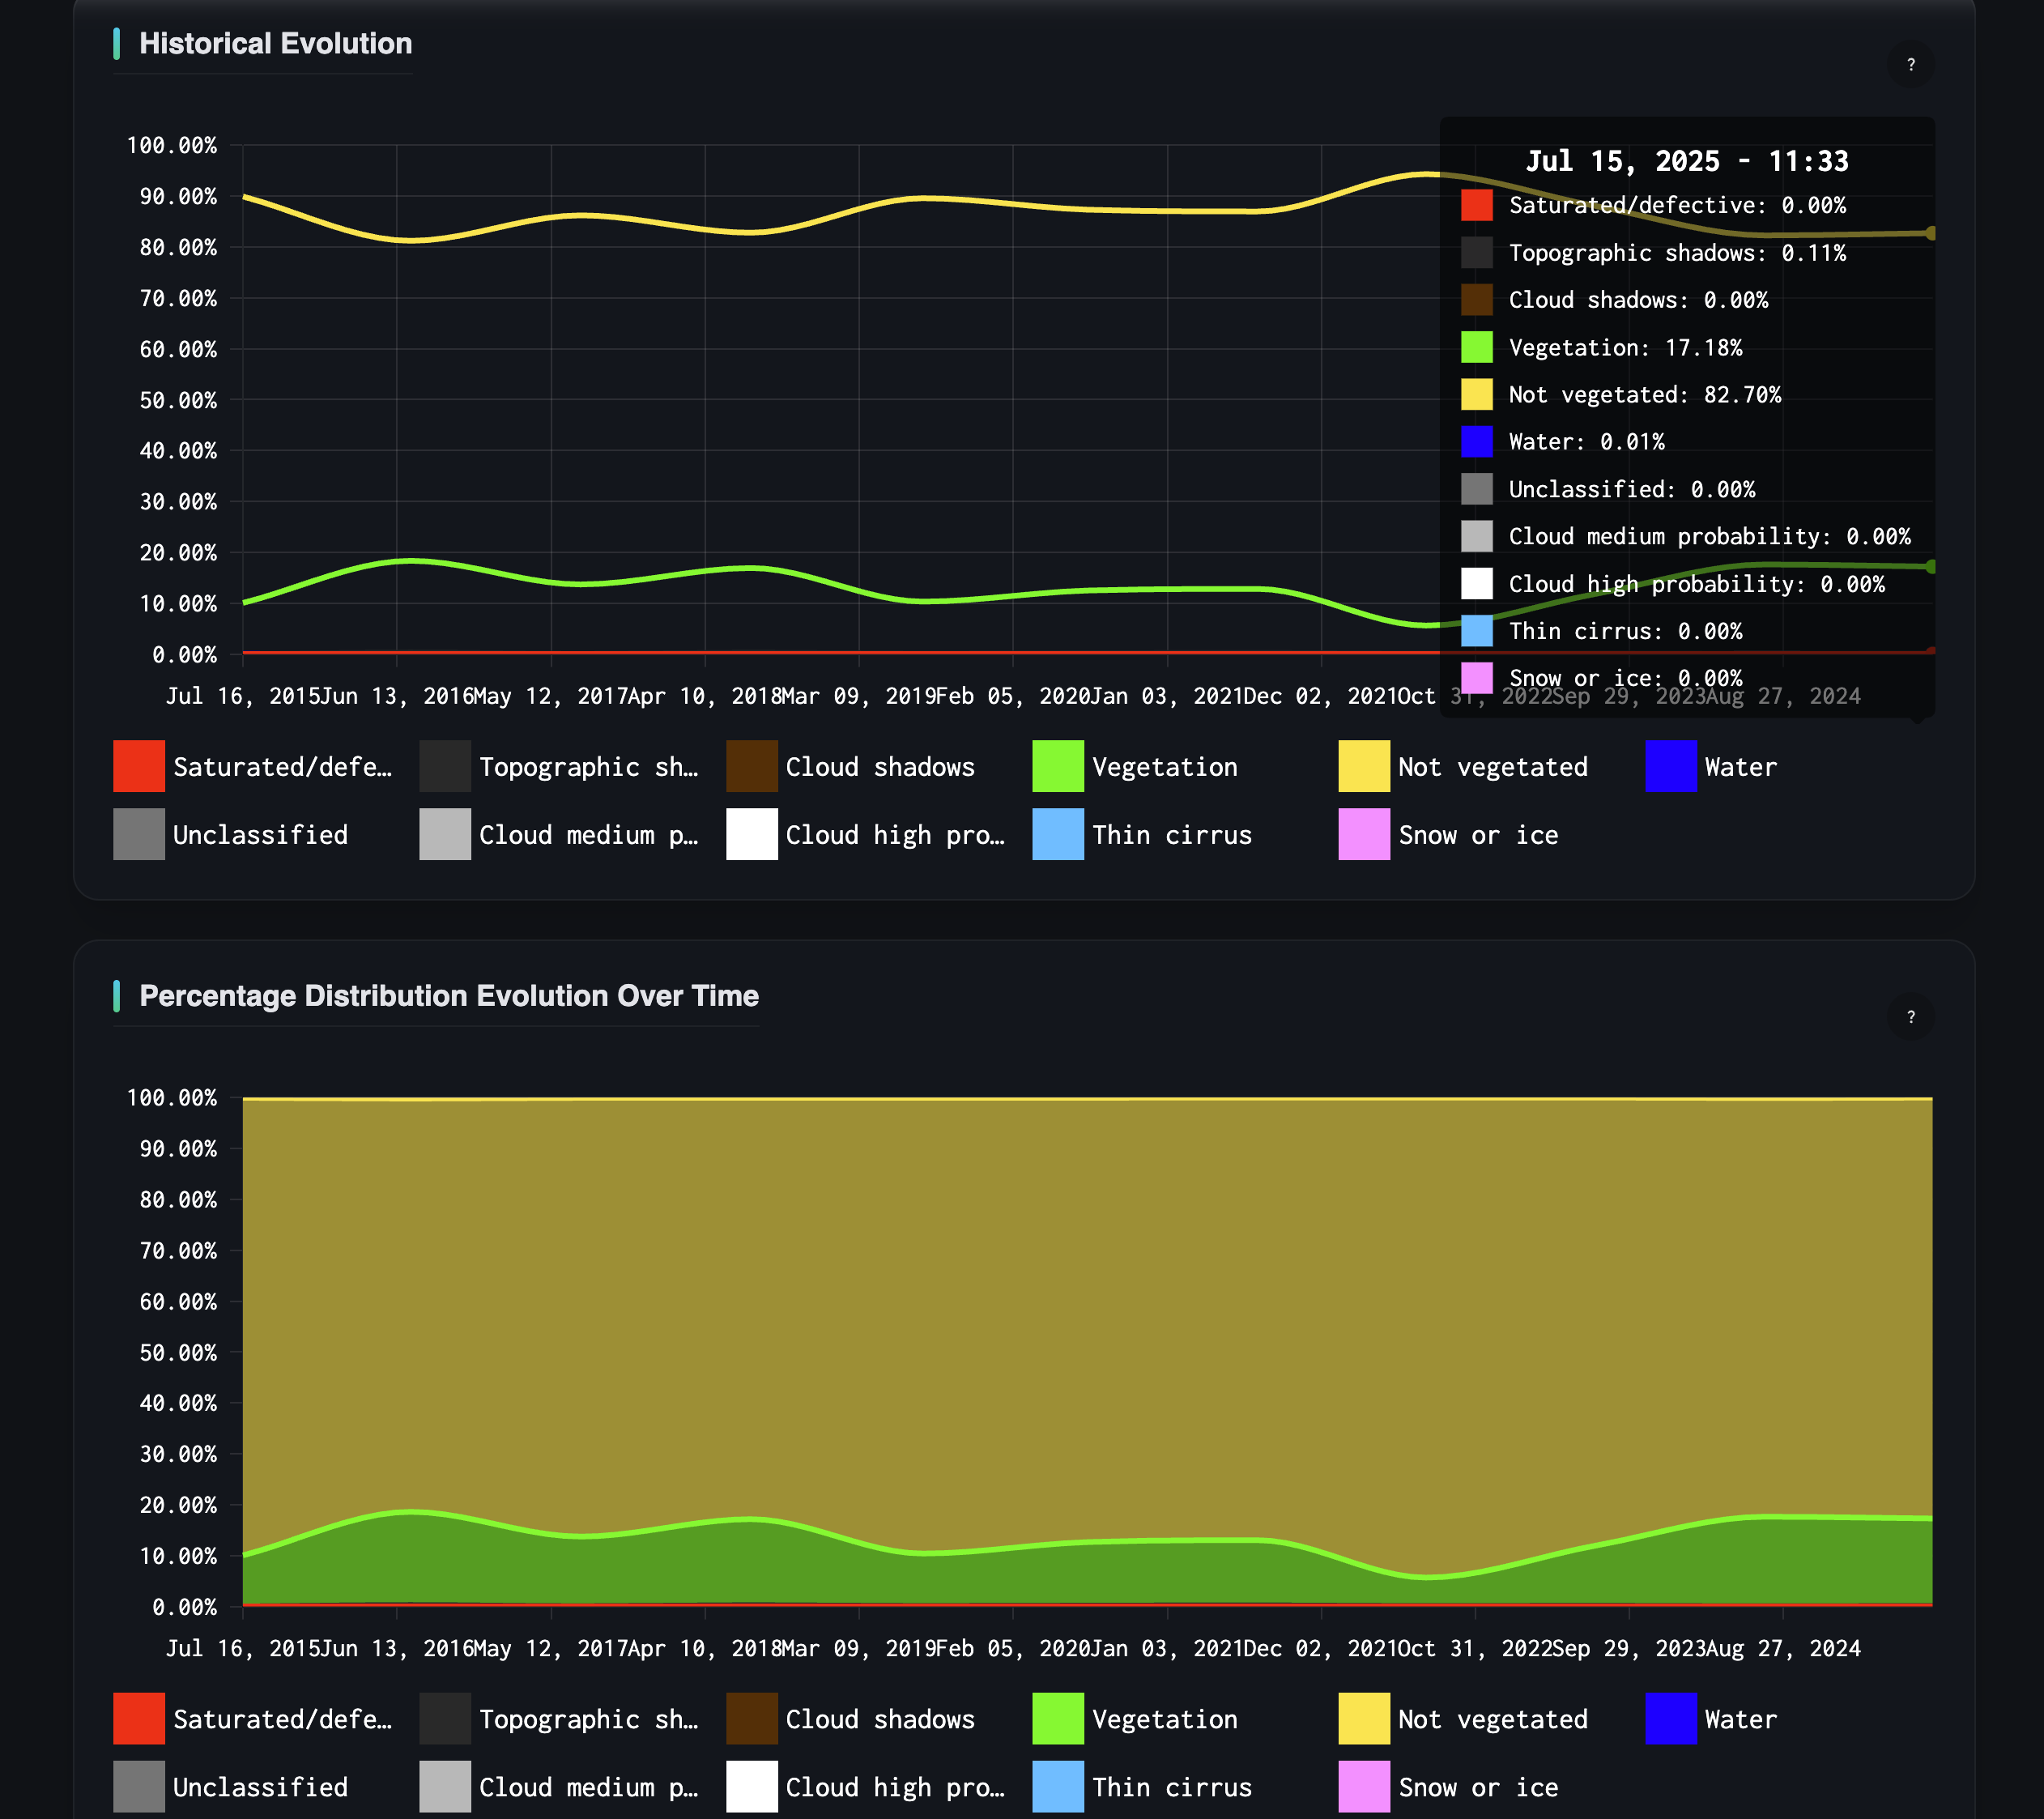
  • Historic landcover analysis: Track how vegetation, water and surface exposure have evolved across years of Sentinel-2 imagery. Change detection per polygon, per index.

  • RGB composite presets: Hydrothermal, Argillic, Phyllic, Lithology, Mafic/Felsic, instantly switchable.

  • Custom Scene Classification: Cloud, shadow and class masks tuned for ore-bearing terrain.

50+ spectral indices, computed live

Cycle through the full library: vegetation, water, iron, alteration, geology. Over your study area.

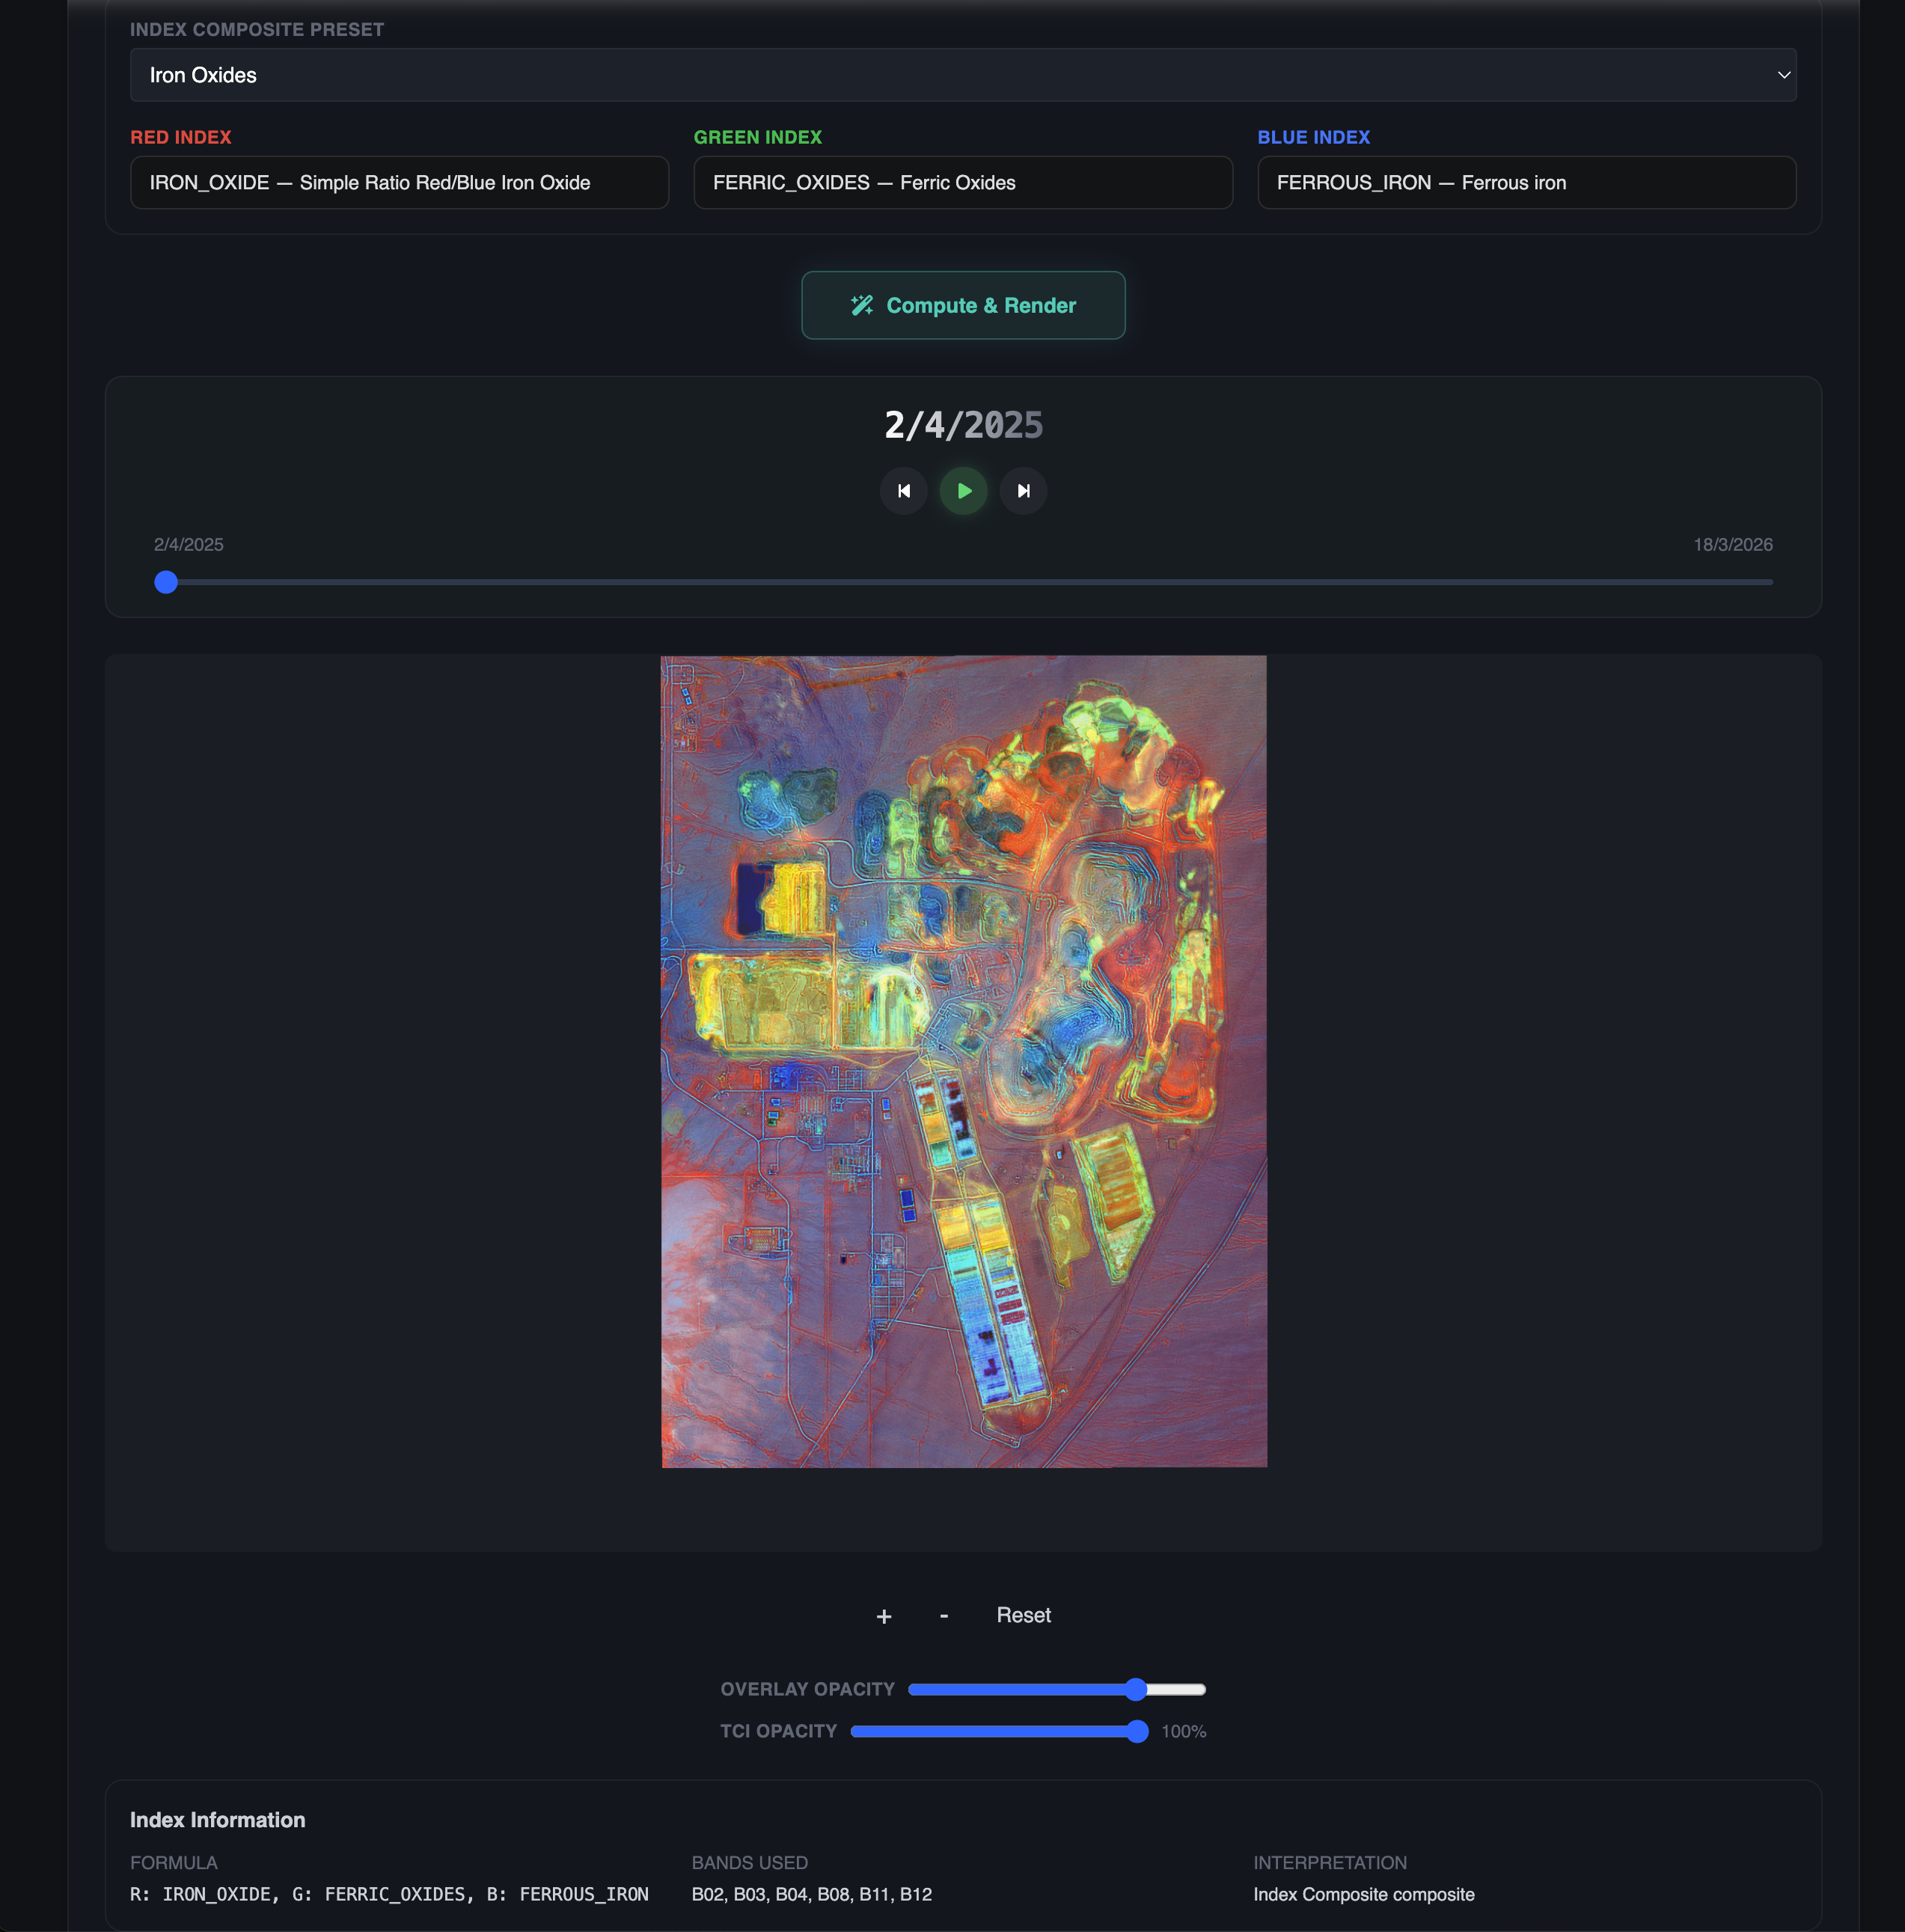
Iron oxide RGB composite

Iron oxide composite

Surface oxidation mapped via the RGB band combination most diagnostic for iron alteration.

Iron mapping composite

Iron mapping

Distinct iron-bearing zones segmented by their spectral fingerprint.

Mafic composite

Mafic / felsic discrimination

Lithological discrimination via mafic-mineral composite bands.

Per-pixel spectral analyzer

Pull a pixel's 10-band signature and match it against the FIRMS spectral library.

Static index report

Index reports, ready for export

Per-polygon, per-date statistics for every index you compute.

From data to interactive report

Explore indices, signatures and statistics live, or share a snapshot via a public link.

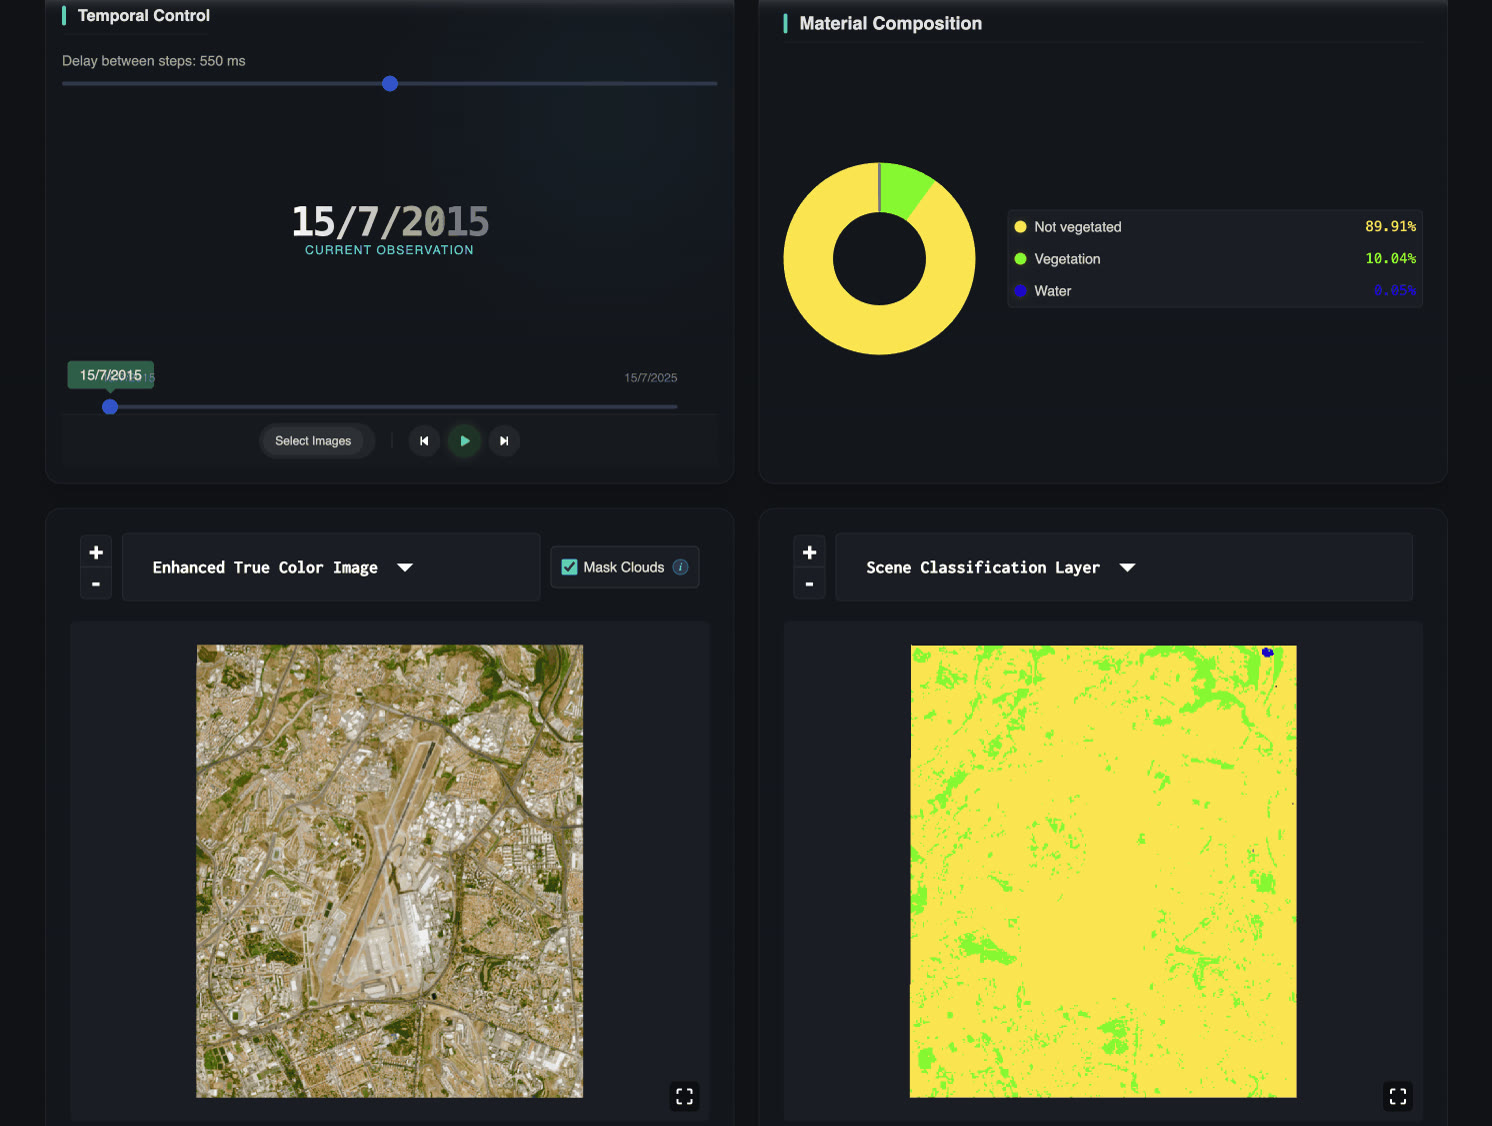
Historic landcover analysis

Historic landcover analysis

Track vegetation, water and surface exposure across years of Sentinel-2 history. Change detection per polygon.

Cross-cutting · Enterprise foundation

Studies, Reports & Sharing

Every analysis becomes a saved, shareable, auditable asset — bundling imagery, indices, statistics, geometry, files and time series. The connective layer beneath every block: AI Assistant, Geotechnics, Discovery, and Computer Vision all write into it.

Studies, Reports & Sharing

Save your work. Share it as a report.

Bundle imagery, indices, statistics and geometry into a named study. Track time-series. Upload your own files. Send a public link to a partner or investor. No login required on their side.

Unified workspace

A unified geospatial workspace

Map, layers, indices, terrain and deposits: every analysis lives on one canvas, bundled into one study.

Shareable public reports

Toggle a study public, send a hash URL. Recipients explore the results without an account.

Historic landcover statistics

Time-series statistics

Track historic landcover and index trends per polygon, per date, ready to chart or export.

Multi-image studies

Group dates, polygons and processing outputs. Status tracking from queue to delivered.

Time-series statistics

Mean, median, std, min/max per polygon, per date, per index. Ready to chart or export.

Public hash links

Toggle visibility, share a URL. Recipients see results without an account, you keep your data private by default.

File uploads

Attach drilling logs, GeoTIFFs and JP2s to polygons. We auto-convert JP2 → GeoTIFF for compatibility.

Side-by-side comparison

Comparison rectangles & polygons let you contrast dates, indices or regions in one view.

Report-ready outputs

Index visualizations, statistics tables, training-data exports. Everything in formats your team already uses.

04

Block 04 · Operational domain

Cameras & Computer Vision

Live operational monitoring and occupational safety on top of existing CCTV and field cameras — detection, segmentation, tracking, stereoscopic 3D localization, PPE and restricted-zone alerts. Real-time site awareness from the camera networks you already have.

Computer Vision · CCTV Integration

Integrate real-time video analytics for safer operations.

Stream camera feeds into the system for operational awareness and occupational safety. Run AI object detection, semantic segmentation and multi-object tracking on live video, place detections in real-world 3D coordinates with stereoscopic pairs, and trigger alerts for PPE, restricted zones and risky behaviors.

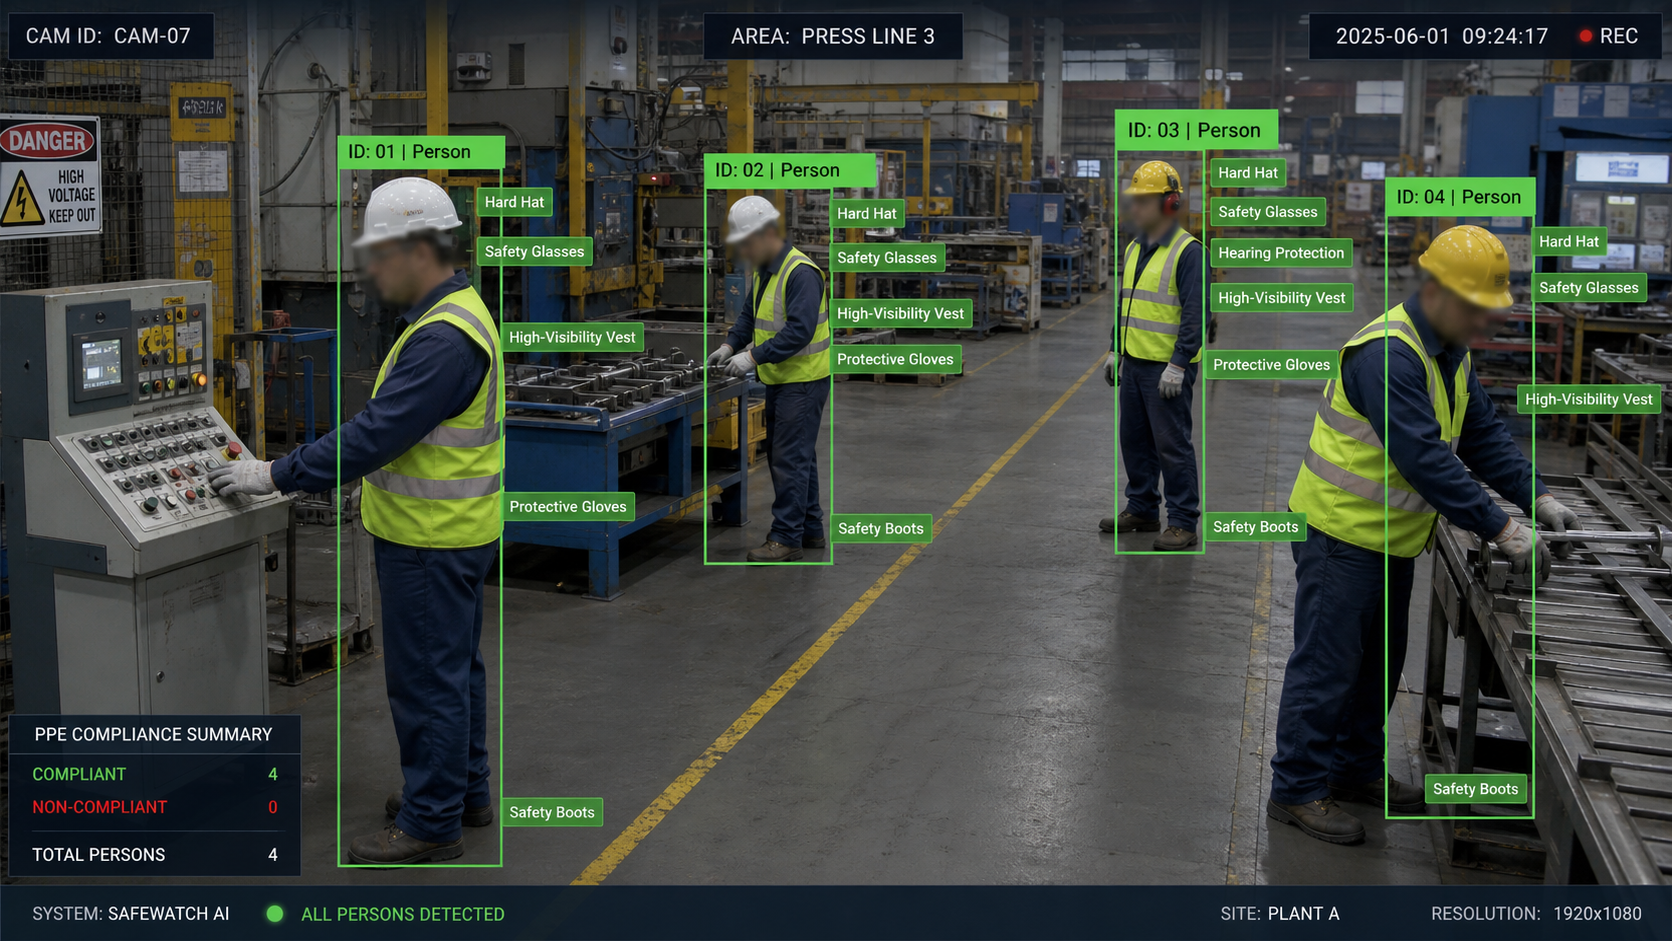
Occupational safety monitoring with computer vision

Occupational safety monitoring

Computer vision can detect people, vehicles, PPE compliance, restricted-zone incursions and risky behaviors, turning camera feeds into proactive safety alerts for site operations.

Camera integration

RTSP / ONVIF / HTTP feeds, multi-site dashboard, edge or central processing. Works with most existing CCTV cameras.

Detection & segmentation

Object detection (people, vehicles, equipment, intrusion and PPE compliance) and semantic segmentation of terrain features, infrastructure and hazards.

3D localization (stereoscopic)

Stereoscopic camera pairs place every detection in real-world 3D coordinates, not just 2D bounding boxes. Accurate distance, area and position for equipment tracking, intrusion mapping and slope inspection.

Tracking & alerts

Multi-object tracking across frames and cameras, plus a configurable alert system routed to your incident management.

Use cases

Real-time operations on the ground

Perimeter security

Equipment monitoring

Access control

Slope & tailings monitoring

Environmental compliance

Behavior anomaly detection

Capability index

Every capability, indexed.

Use this as your map back to anything you've seen. Click any card to jump.

03

Discovery & Exploration

Mineral Prospectivity

Where to look next, weighted by evidence.

  • 10+ evidence layers: spectral, mines, faults, lithology, terrain, indices
  • Bayesian fusion with calibrated priors and tunable base rate
  • Anchor on known occurrences: positive & negative reference points
  • Per-commodity probability: not a black-box score

Spectral Similarity & Classification

Find every pixel that looks like this. Anywhere on Earth.

  • Global spectral fingerprint database: pre-computed at planetary scale
  • Similarity search from a single reference pixel
  • Automatic grouping (K-Means / DBSCAN) with training-data export
  • Train your own classifier: draw ROIs, predict across the full scene
  • Project any spectral index globally: no scene download required

Geological Maps & Deposits

Every public map + 12,000 known deposits, on the same canvas.

  • WMS / WFS / ArcGIS proxies, vector contacts, faults + raster geology
  • 12,000+ global deposits, filterable by commodity, mineral, rock type
  • Click-to-identify: lithology code, age, source on every feature
  • Favorability grids: lithology + fault proximity feed prospectivity

Spectral Analysis & Composition

50+ indices and direct mineral identification.

  • 50+ indices: Gossan, Iron Oxide, Ferric/Ferrous, Hydrothermal, Argillic, Phyllic, NDVI, NDWI…
  • USGS / FIRMS library matching on a 10-band pixel fingerprint
  • RGB composite presets: alteration mapping in one click
  • Custom Scene Classification tuned for ore-bearing terrain
  • Historic landcover: multi-year change detection per polygon

Terrain & Cross-Sections

Read topography. Slice through geology.

  • Global DEMs: AWS Terrarium, Mapbox Terrain, MapTiler
  • Slope & aspect grids: heatmaps for terrain favorability
  • Elevation profile + geological transect along any line
  • 3D layered visualization: spectral, structural and terrain stacked

Sentinel-2 & AI Super-Resolution

Search Copernicus. Enhance to 1 meter.

  • Copernicus search: filter by polygon, cloud %, date range
  • 10 m → 1 m AI super-resolution (asynchronous, multi-date)
  • Progress tracking, retry and cancellation
  • GeoTIFF exports for QGIS, ArcGIS or your pipeline
04

Computer Vision · CCTV Integration

CCTV feed integration

Plug your existing camera network into the platform.

  • RTSP / ONVIF / HTTP feeds: works with most existing CCTV cameras
  • Multi-feed dashboard: every camera, every site, in one view
  • Edge or central processing to match your network topology
  • On-premise option for sensitive sites

Detection, segmentation & tracking

AI vision models running on your video, with configurable alerts.

  • Object detection: people, vehicles, equipment, intrusion
  • 3D localization (stereoscopic): every detection placed in real-world 3D coordinates, not just a bounding box
  • Semantic segmentation: terrain features, infrastructure, hazards
  • Multi-object tracking across frames and cameras
  • Configurable alerts: by zone, behavior, time of day; routes to email, Slack or webhook

Section 5 · Enterprise value

Less distance between data, experts, and decisions.

TerraCroma turns AI orchestration, geospatial intelligence and enterprise-grade deployment into measurable business value.

01

Faster decisions

AI orchestrates workflows that normally need many manual steps — from prompt to map.

From Block 01

02

Better target priorities

Exploration evidence fused into ranked, explainable targets — calibrated, not opaque.

From Block 03

03

Earlier risk detection

InSAR, AI deformation models and sensor fusion catch motion before it accelerates.

From Block 02

04

Unified visibility

Imagery, geology, terrain, sensors, documents and cameras — one workspace, one map.

Cross-cutting

05

Enterprise control

Private deployment, document grounding, access control and full audit trail.

From Block 01

TerraCroma

Discover, monitor, and understand the Earth through AI.

AI orchestration Exploration intelligence Terrain stability Real-time visual Enterprise reporting

TerraCroma turns fragmented geospatial, geological and operational data into explainable decisions.

Custom AI projects

Need a custom project?

Cambrian Intelligence SL is the company behind TerraCroma. We develop custom AI projects based on this platform, adapted to your workflows and data environment.

Use TerraCroma as the foundation for secure, domain-specific AI systems that leverage your own internal data.

Built on TerraCroma

Start from the platform's geospatial, document, vision and orchestration capabilities instead of building from scratch.

Internal data integration

Bring together reports, drilling logs, GIS layers, imagery, sensor streams and operational knowledge into one governed AI workspace.

Custom AI models

Train or adapt models, classifiers and assistants around your terminology, decision criteria and private datasets.

Talk to Cambrian Intelligence SL

Email
Company address
cambrianintelligence.com

Start Exploring.

Reach out for a tailored demo on your district of interest. We'll set up a workspace pre-loaded with your area's imagery, geological maps and deposit data.

Contact us at